 Ruby
Ruby This post has not been updated in quite some time and the content here may be out of date
or not reflect my current my recommedation in the matter.
This post has not been updated in quite some time and the content here may be out of date
or not reflect my current my recommedation in the matter.Overview
InfluxDB is a distributed time series database. It is a specialized data store for saving large volumes of timestamped event data and this makes it especially suited for storing metrics, lifecycle events and analytics. The influxdb-rails gem, maintained by the InfluxDB team, facilitates integration with Rails and makes it easy to save various metrics from a rails application to InfluxDB and visualize it through frontends like Grafana.
The rest of this post, explores various aspects of a simple setup in which we build a rudimentary cms based site and monitor it using influxdb and grafana. We don't assume prior familiarity with InfluxDB, and elaborate on relevant aspects of time series databases on the go, but familiarity with Rails is assumed.
This post also assumes that InfluxDB is installed as per the official installation instructions with default configuration. If installation has been customized eg. ports have been changed, the configurations provided to influxdb-rails will have to be adapted accordingly. On mac influxdb can be installed using Homebrew : brew install influxdb.
Setting up a basic application
Next, we bootstrap a simple rails application using the Comfortable mexican sofa CMS to quickly setup a site with a few pages we can tinker with. This is not really important, but it simply helps us work with a reasonably more realistic setup than a typically crud ui generated through scaffolds.
rails new influxdb-cms-demo --database=mysqlIn Gemfile:
gem 'comfortable_mexican_sofa', '~> 1.12.0'
gem 'influxdb-rails'
Setting up CMS requires an additional step:
rails generate comfy:cmsSetting up InfluxDB adapter also requires an additional step:
rails g influxdbThe default configuration options are available in the generated influxdb-rails.rb and they correspond to the default settings of influxdb.
InfluxDB::Rails.configure do |config|
  config.influxdb_database = "rails"
  config.influxdb_username = "root"
  config.influxdb_password = "root"
  config.influxdb_hosts    = ["localhost"]
  config.influxdb_port     = 8086

  # config.series_name_for_controller_runtimes = "rails.controller"
  # config.series_name_for_view_runtimes       = "rails.view"
  # config.series_name_for_db_runtimes         = "rails.db"
end
The last three lines signify the names of time series where the corresponding metrics would be stored, and we will use the same when querying the time series database.
Before our application can start dispatching metrics to InfluxDB the database "rails" specified in the above configuration file would have to be created. InfluxDB admin provides a means to do that using the GUI. The admin interface may be accessed by visiting: localhost:8083
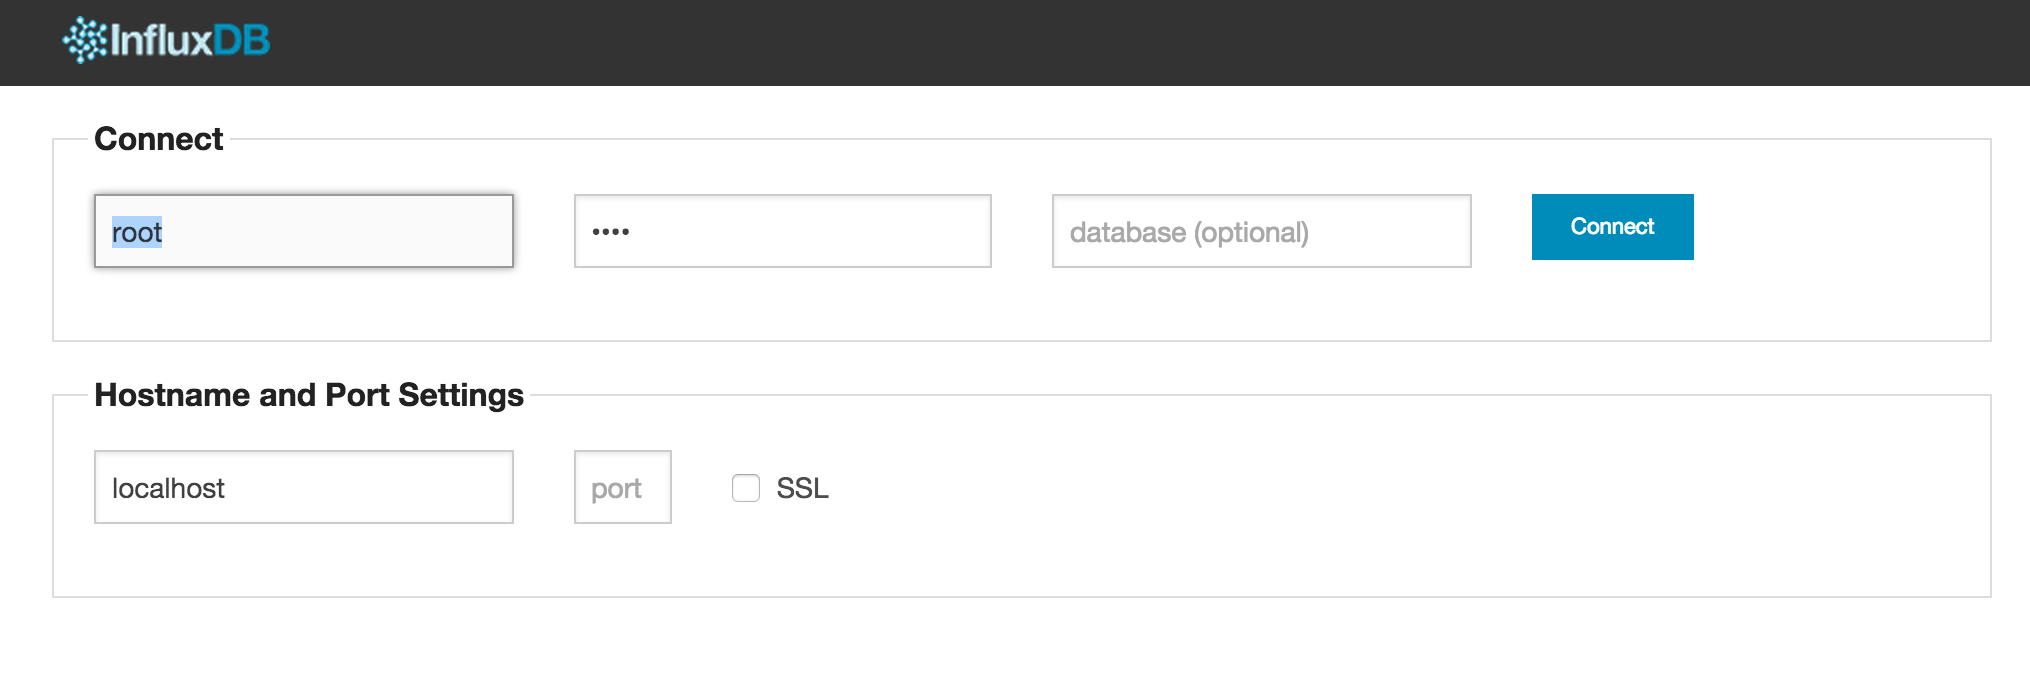
The default username/password combination is root/root, which is not advisable for production use.
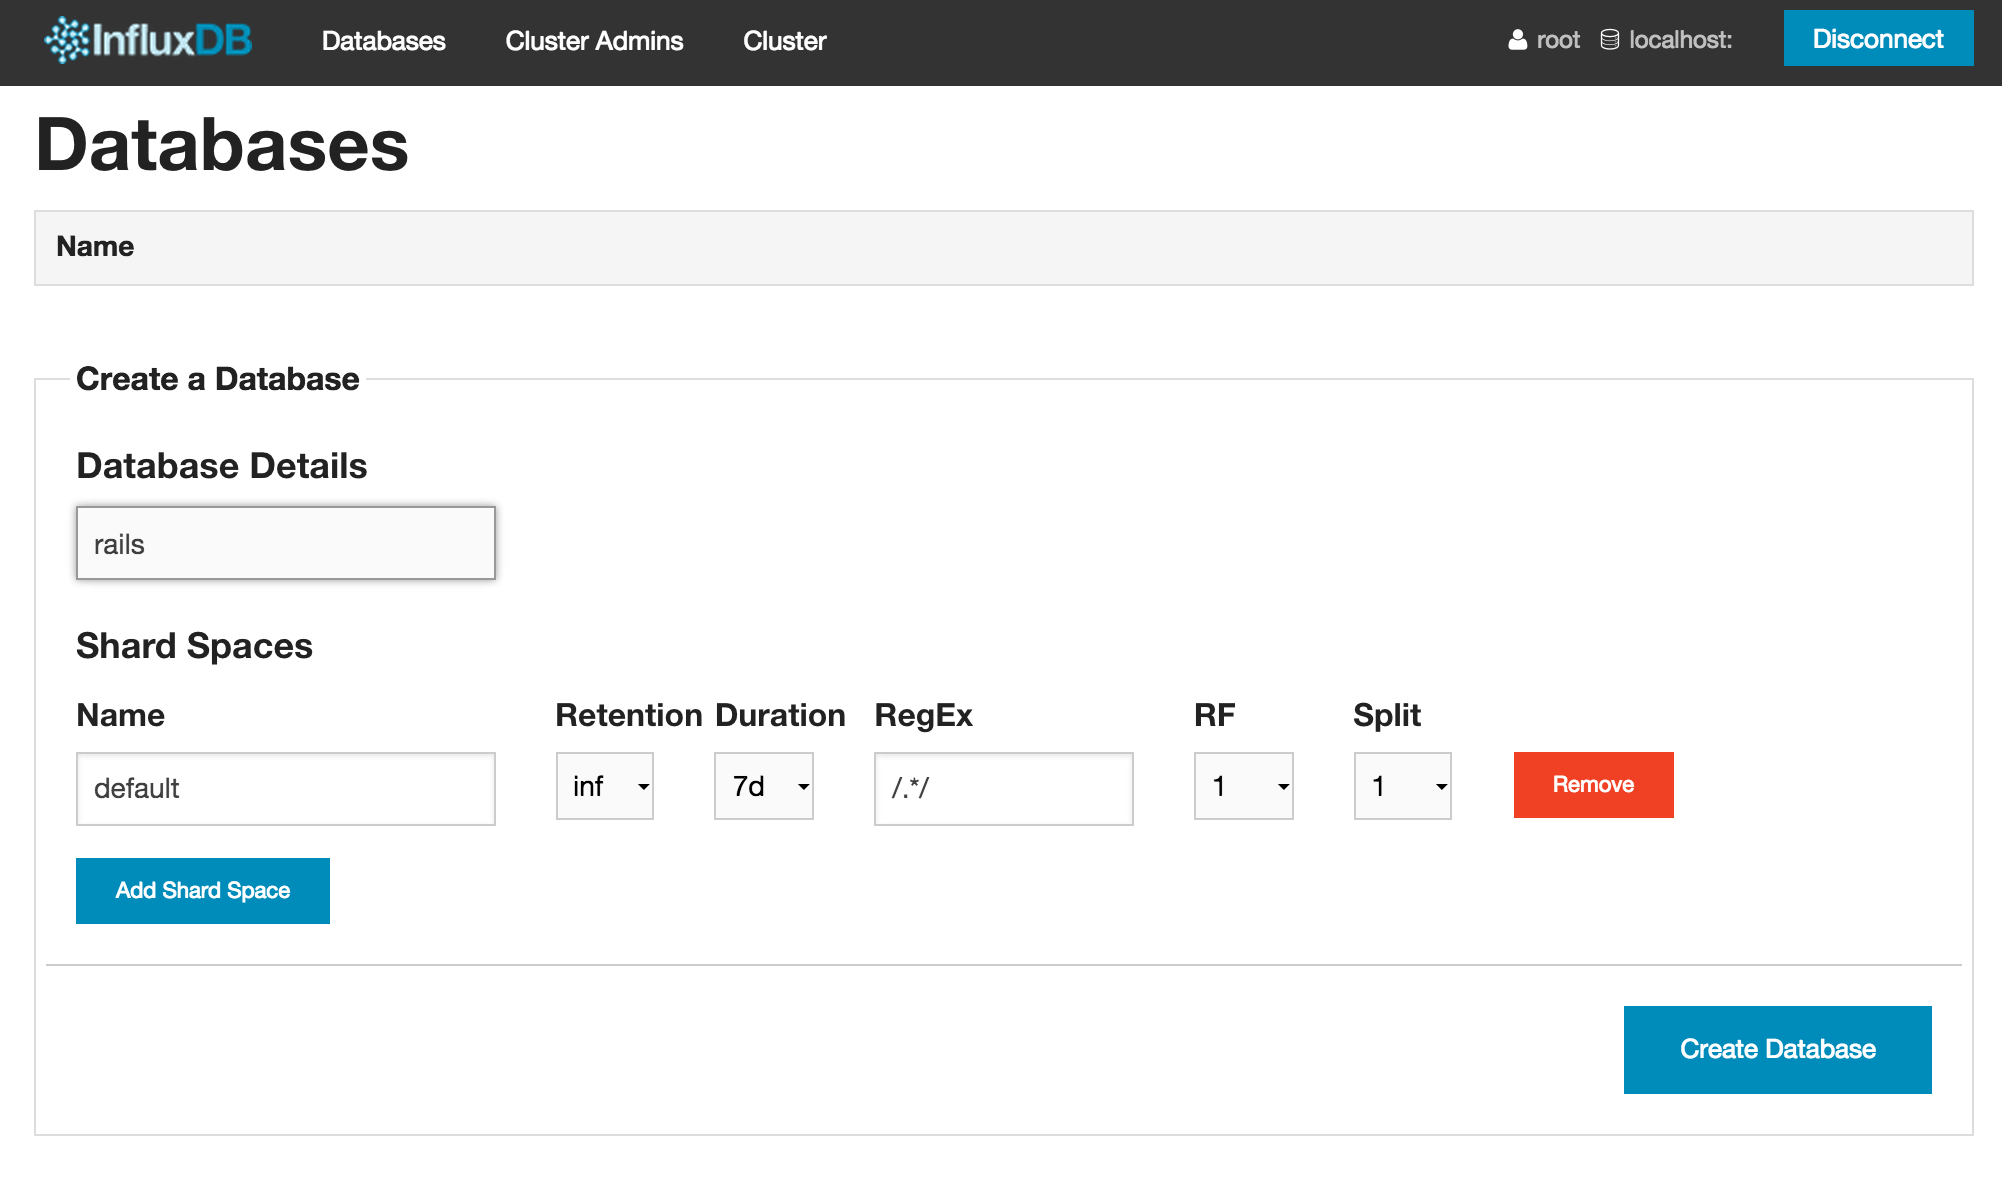
The only option that is particularly relevant is database name: which we would have to change to "rails".
This would be a good point to run db:migrate and visit the CMS dashboard /admin
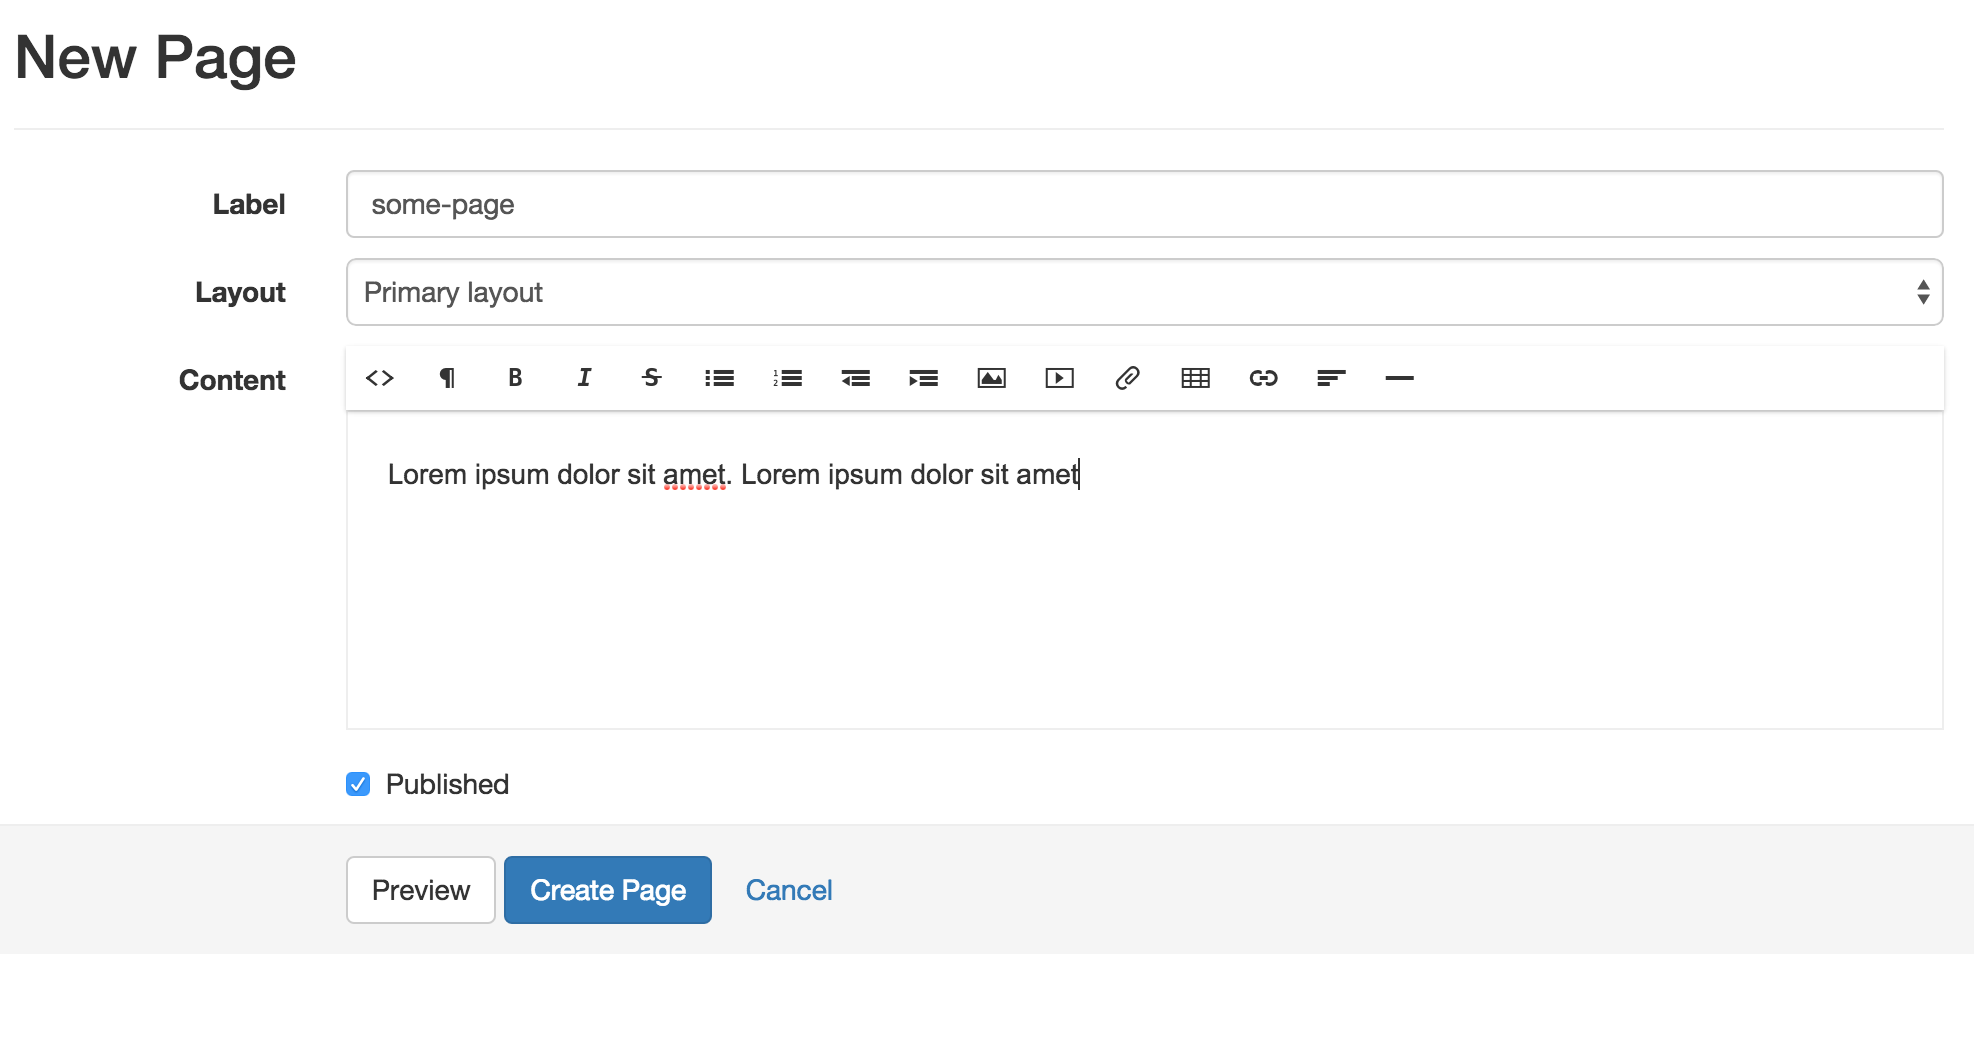
Once a new site has been bootstrapped, we can rapidly create multiple pages through the CMS admin interface. These steps are not elaborated here because the guided CMS admin makes it pretty trivial. Once a few pages have been setup, we have some metrics to explore in InfluxDB.
Data exploration
In the list of databases, we should have an option to Explore Data. Let us go ahead and click that:
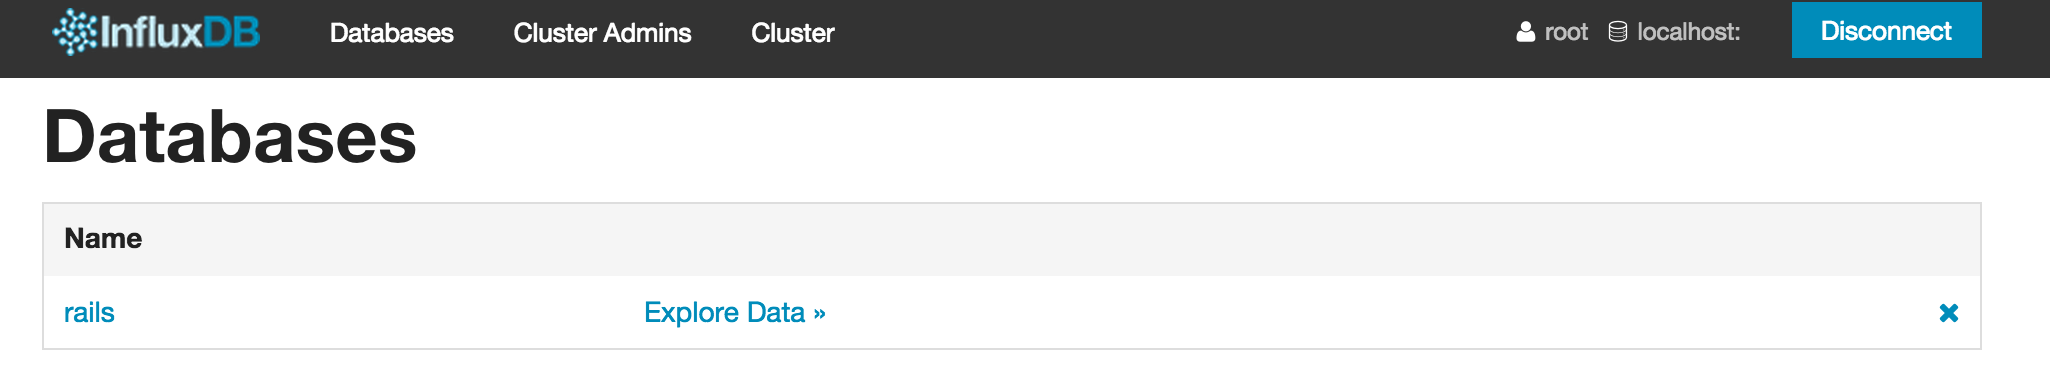
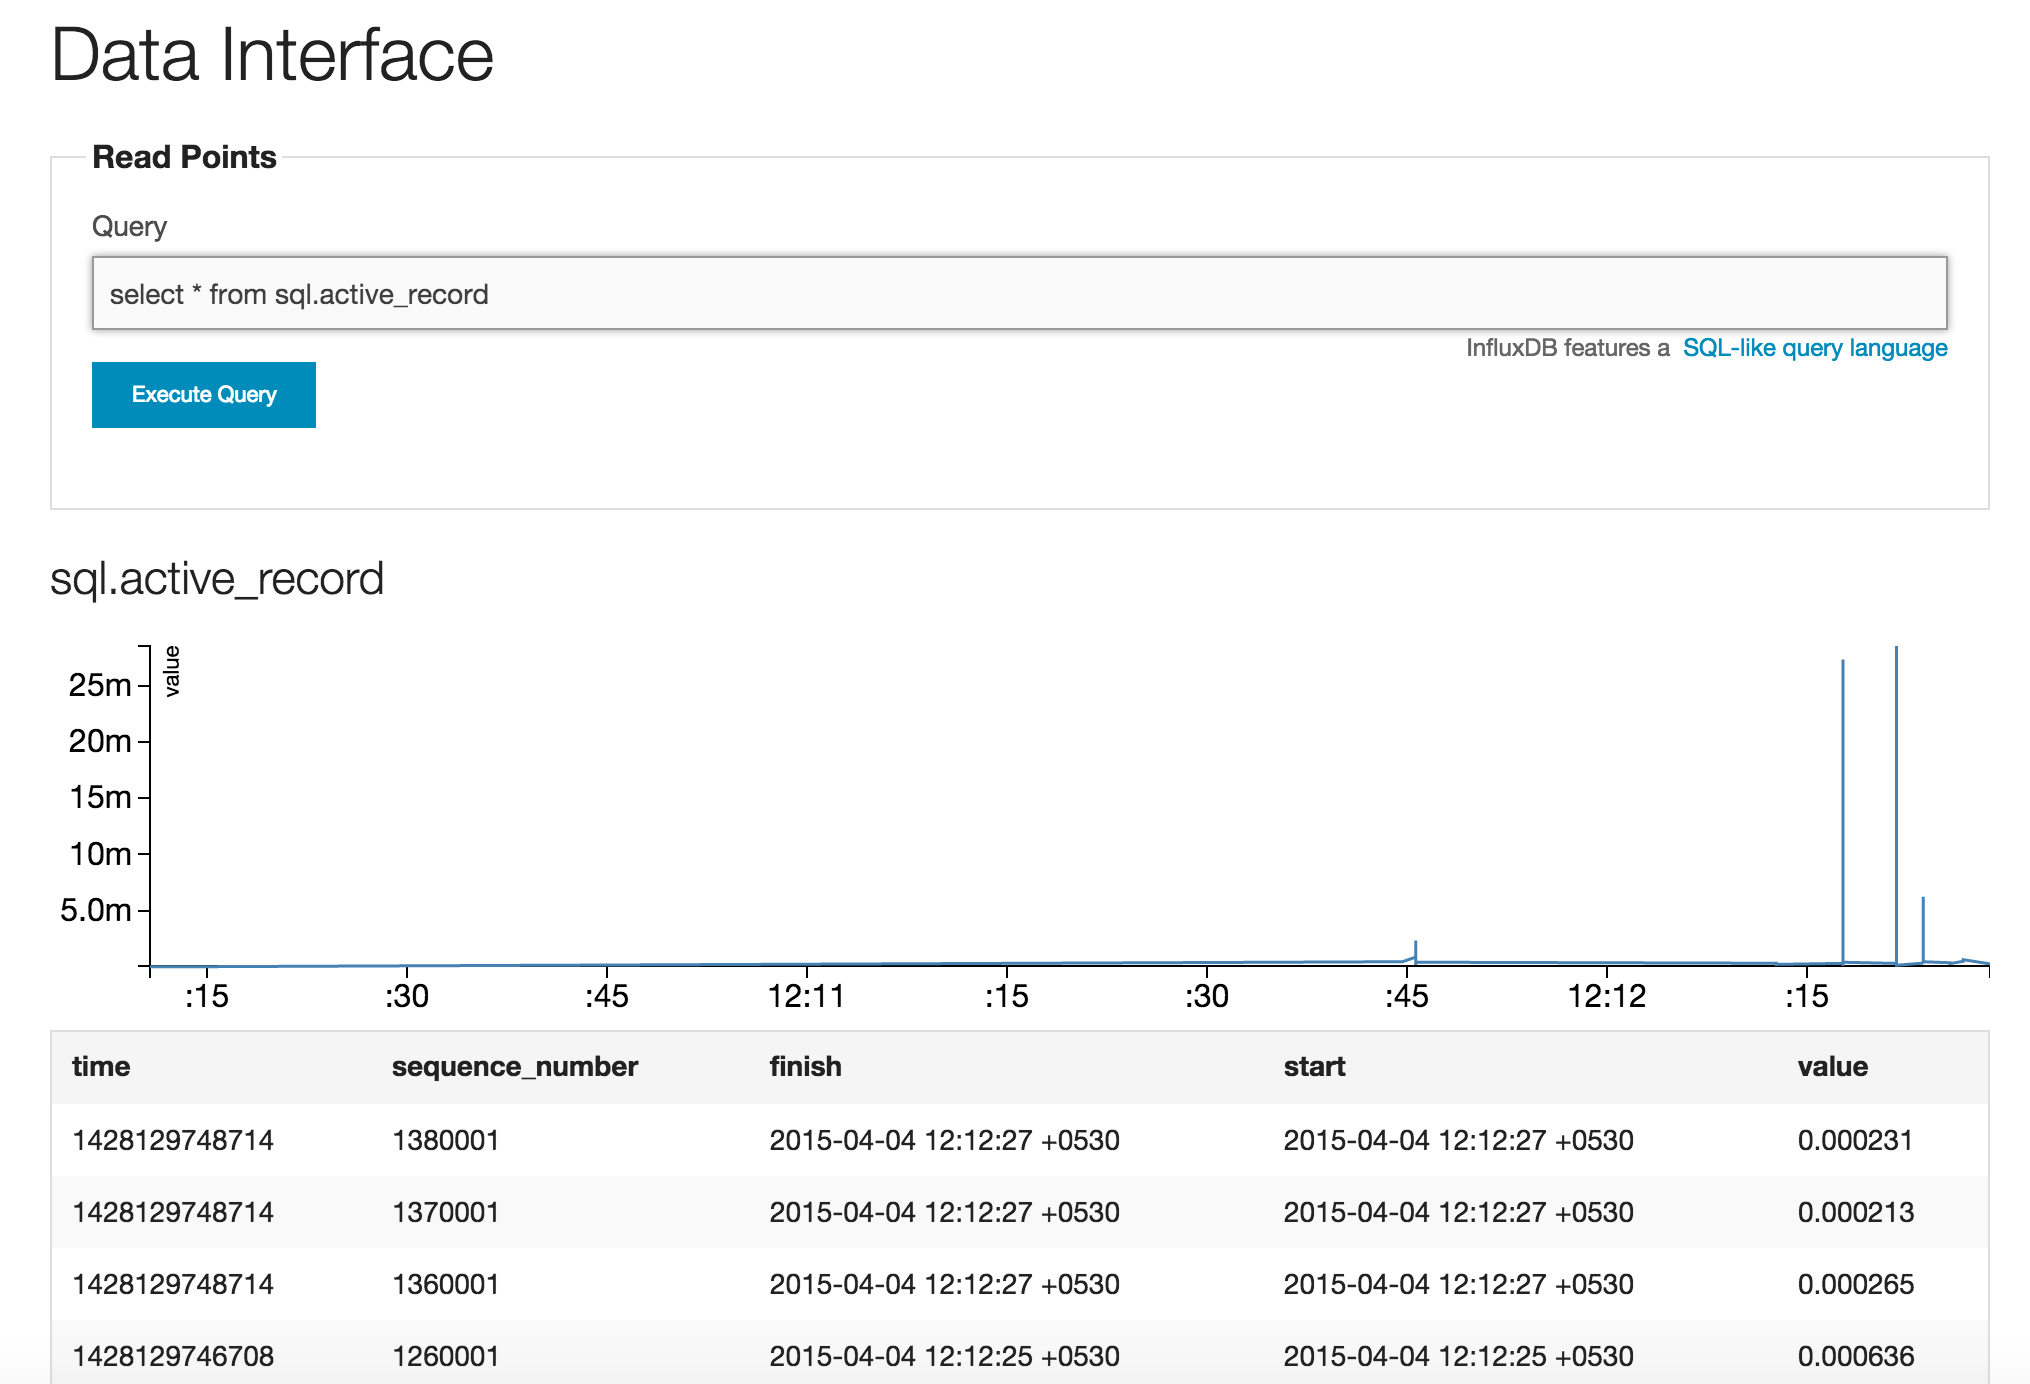
We will be presented with a simple interface to read and write points (which are essentially multi-column timestamped datasets).
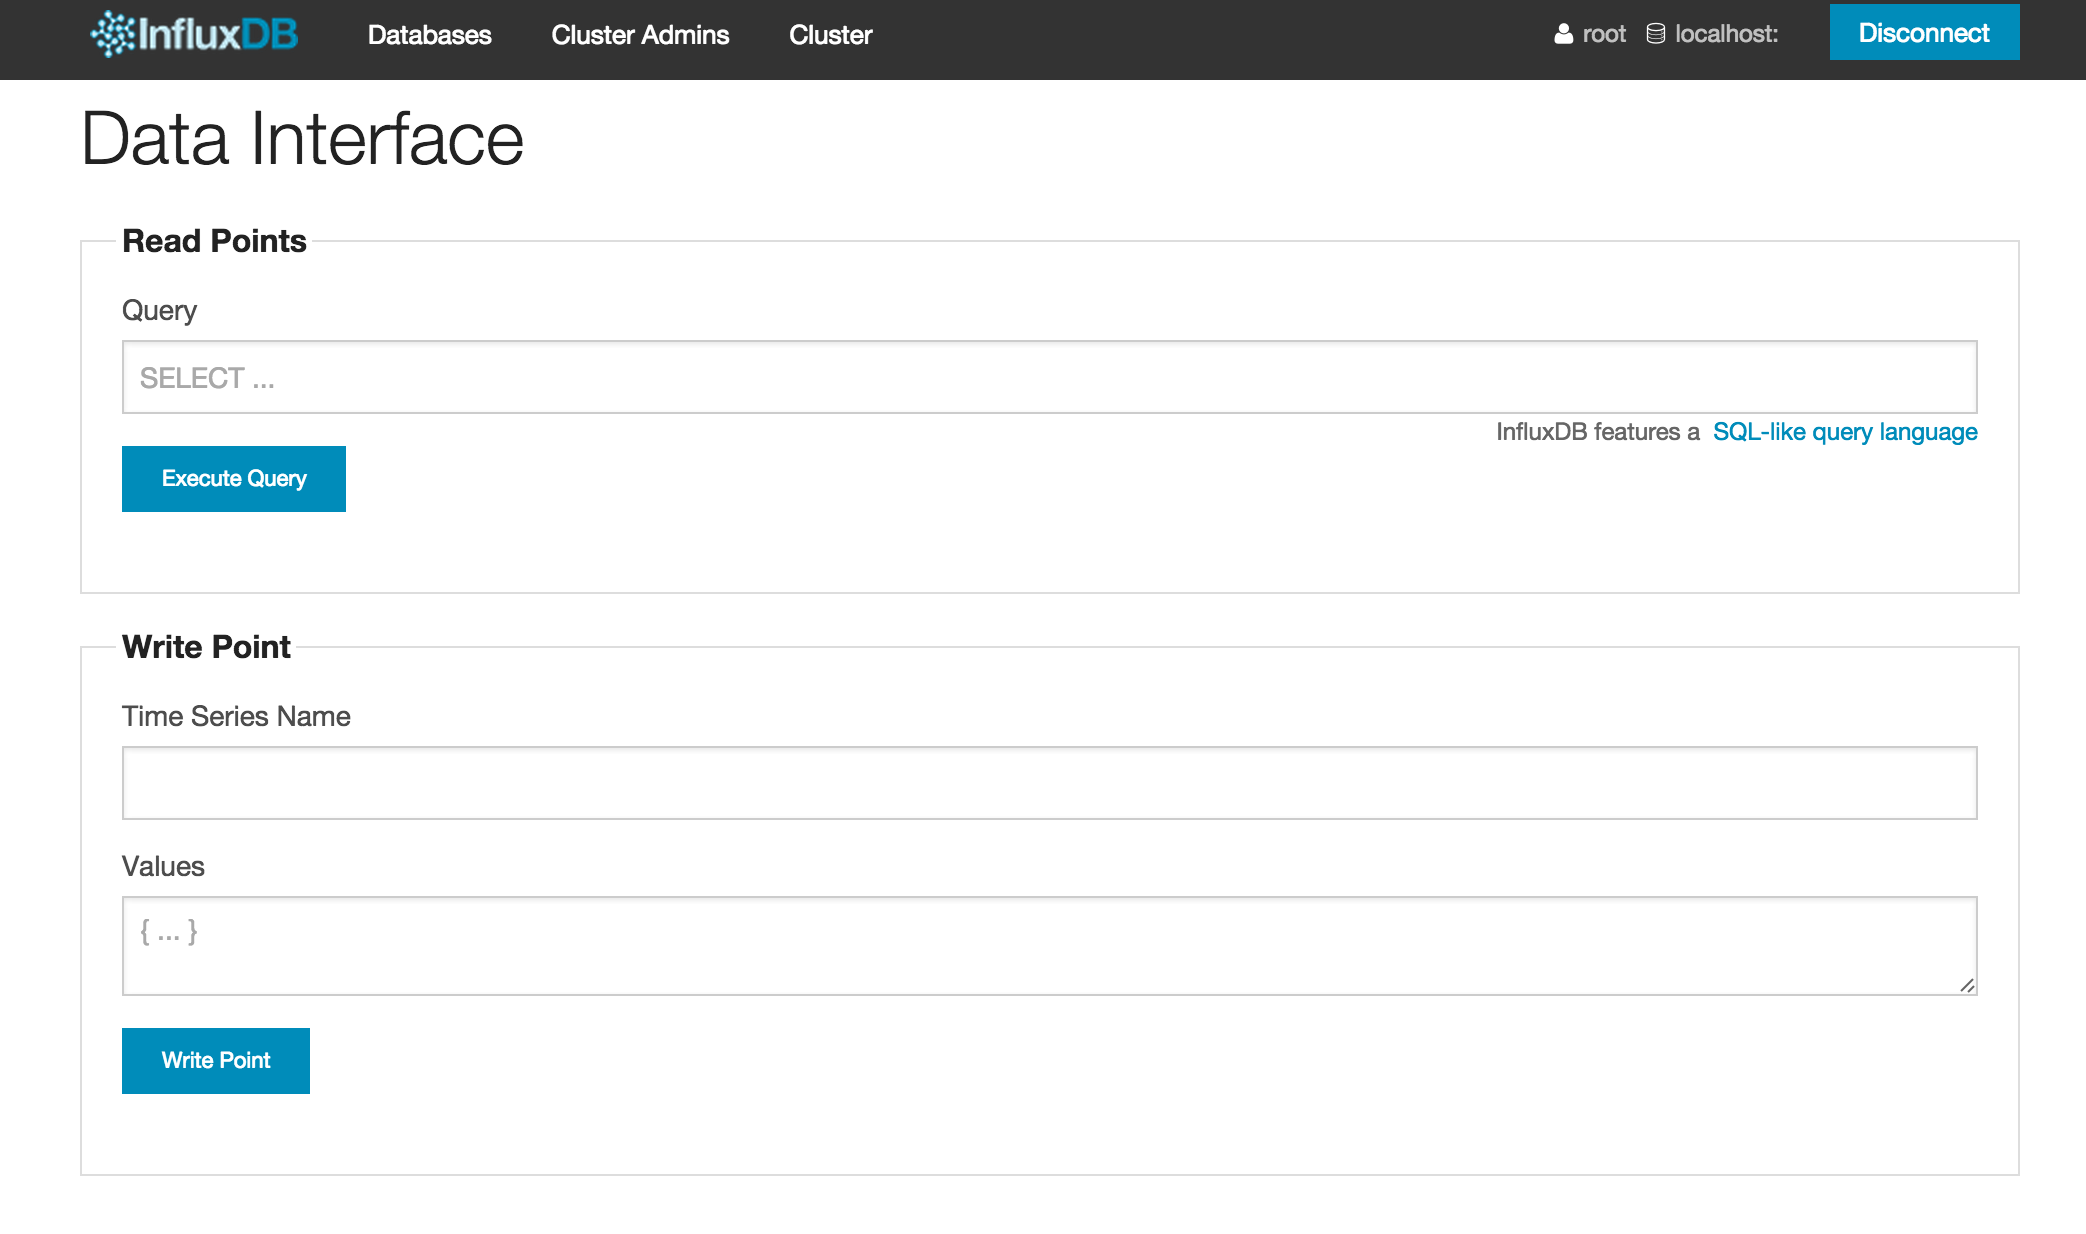
This page also highlights an interesting aspect of InfluxDB - though it is not a relational database, it does provide an SQL like language to query the database.
A basic query might look something like this:
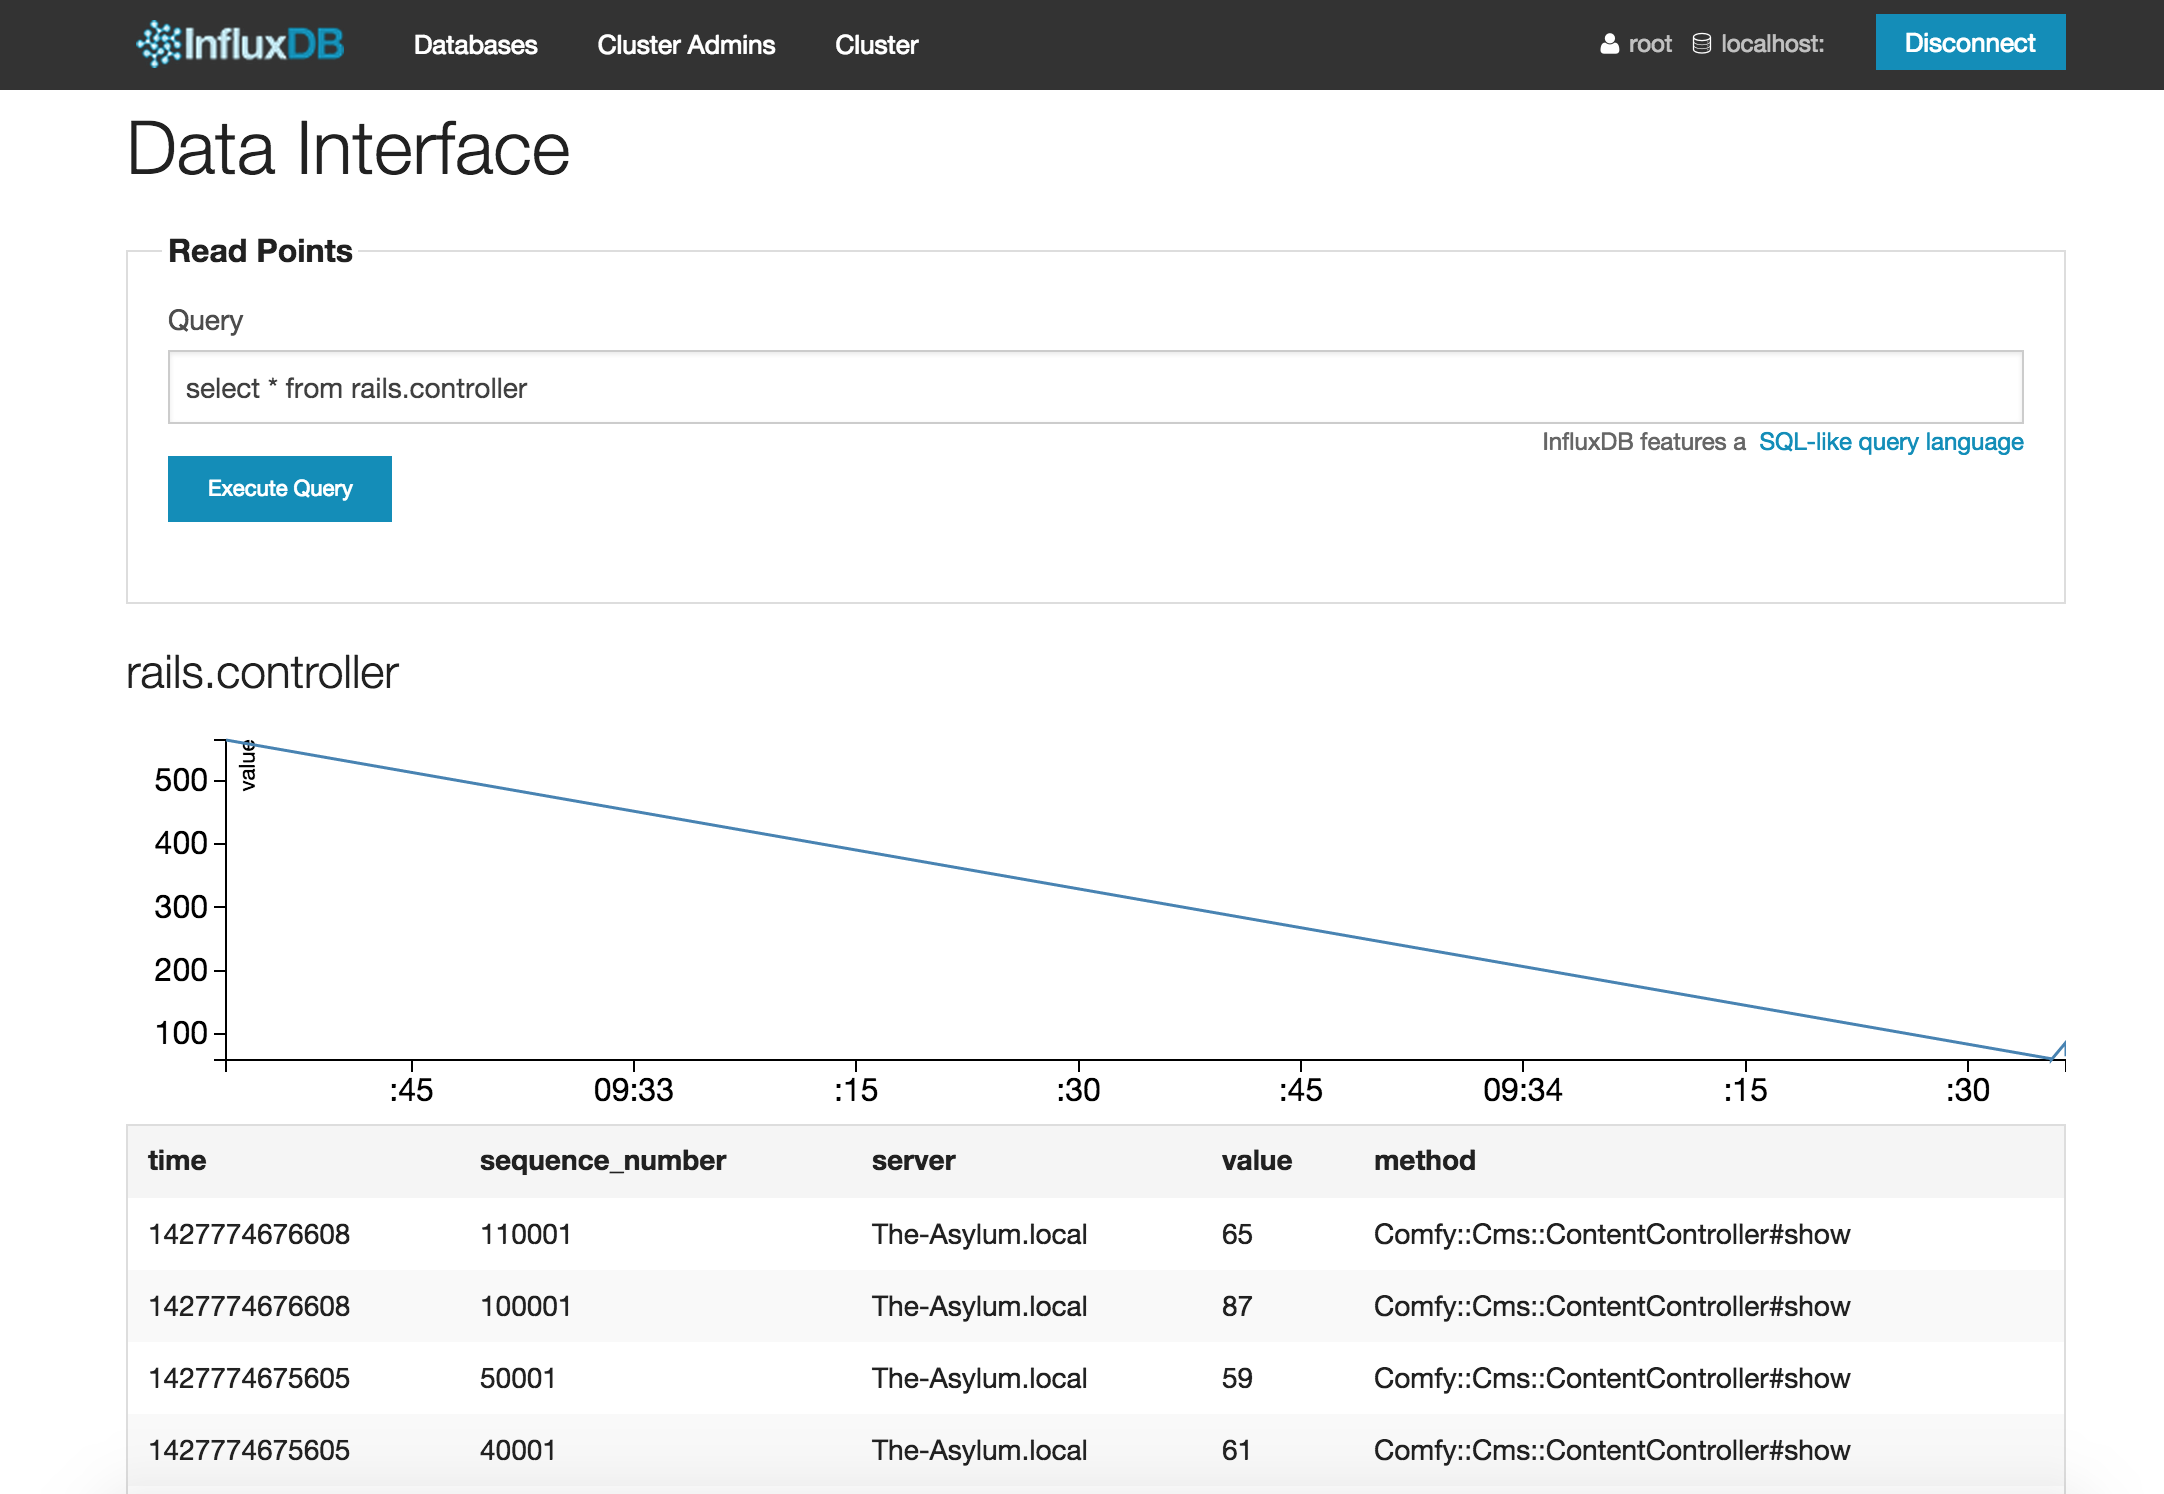
Besides controllers, we can also run similar queries for our timeseries for views and db:
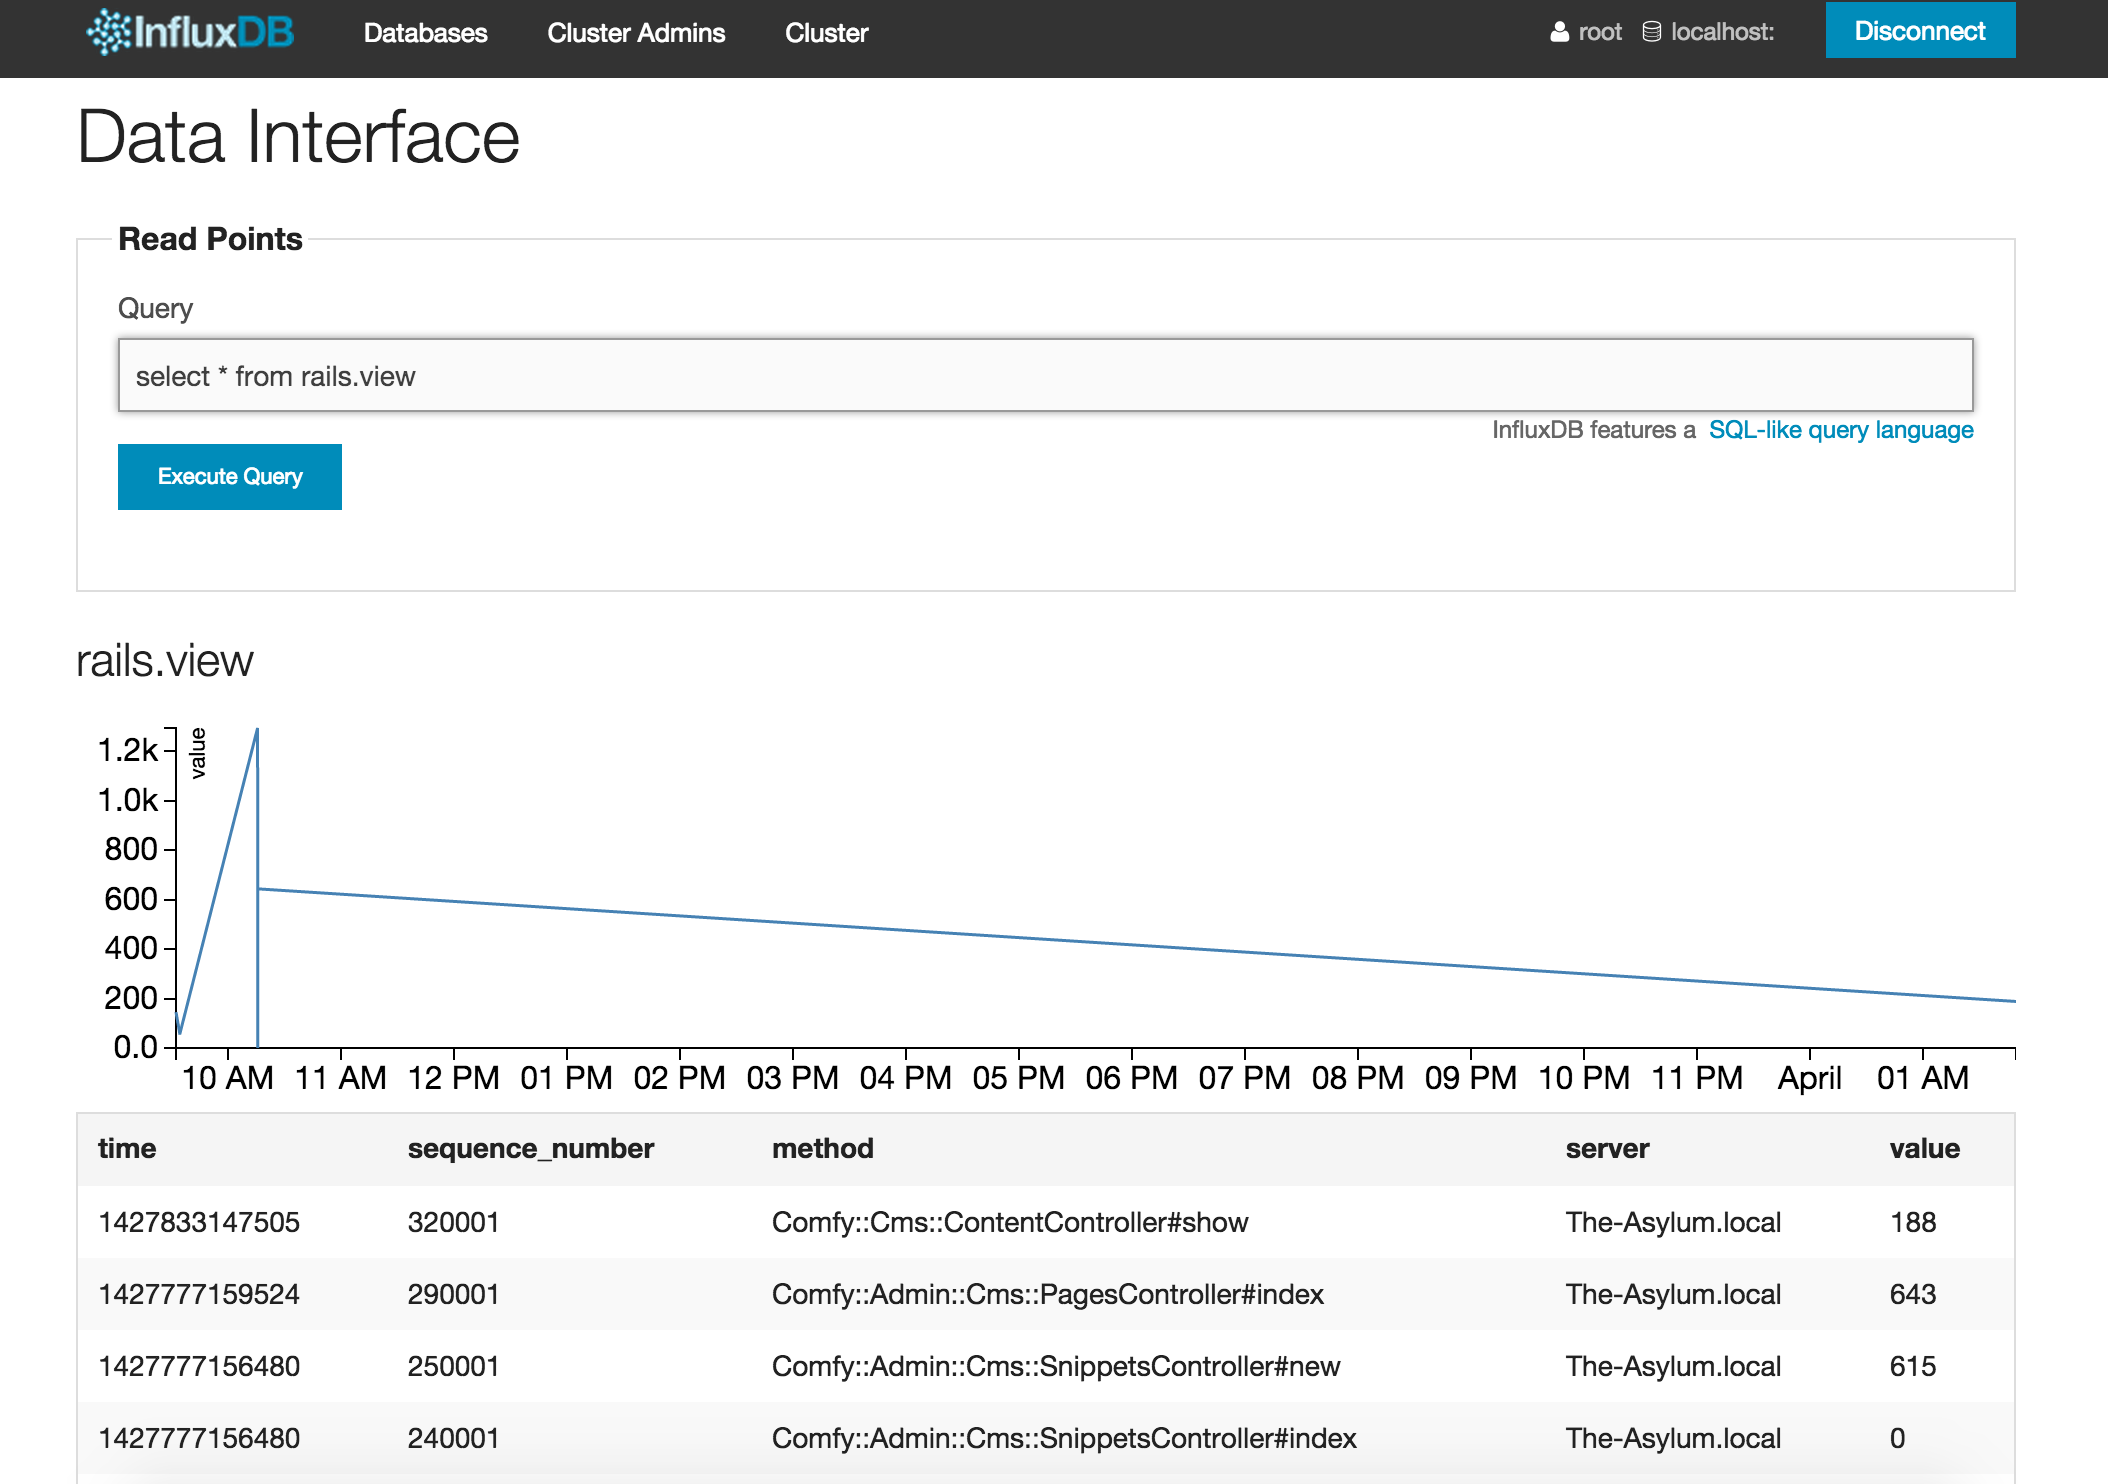
Configuring additional lifecycle events
In a real applications we would want to aggregate additional metrics of our choosing. A popular solution for dispatching and subscribing to various lifecycle events that ruby community has developed is ActiveSupport::Notifications which Rails internally uses.
Using ActiveSupport::Notifications we can subscribe to lifecycle events of a rails application and add callbacks to dispatch these metrics to InfluxDB.
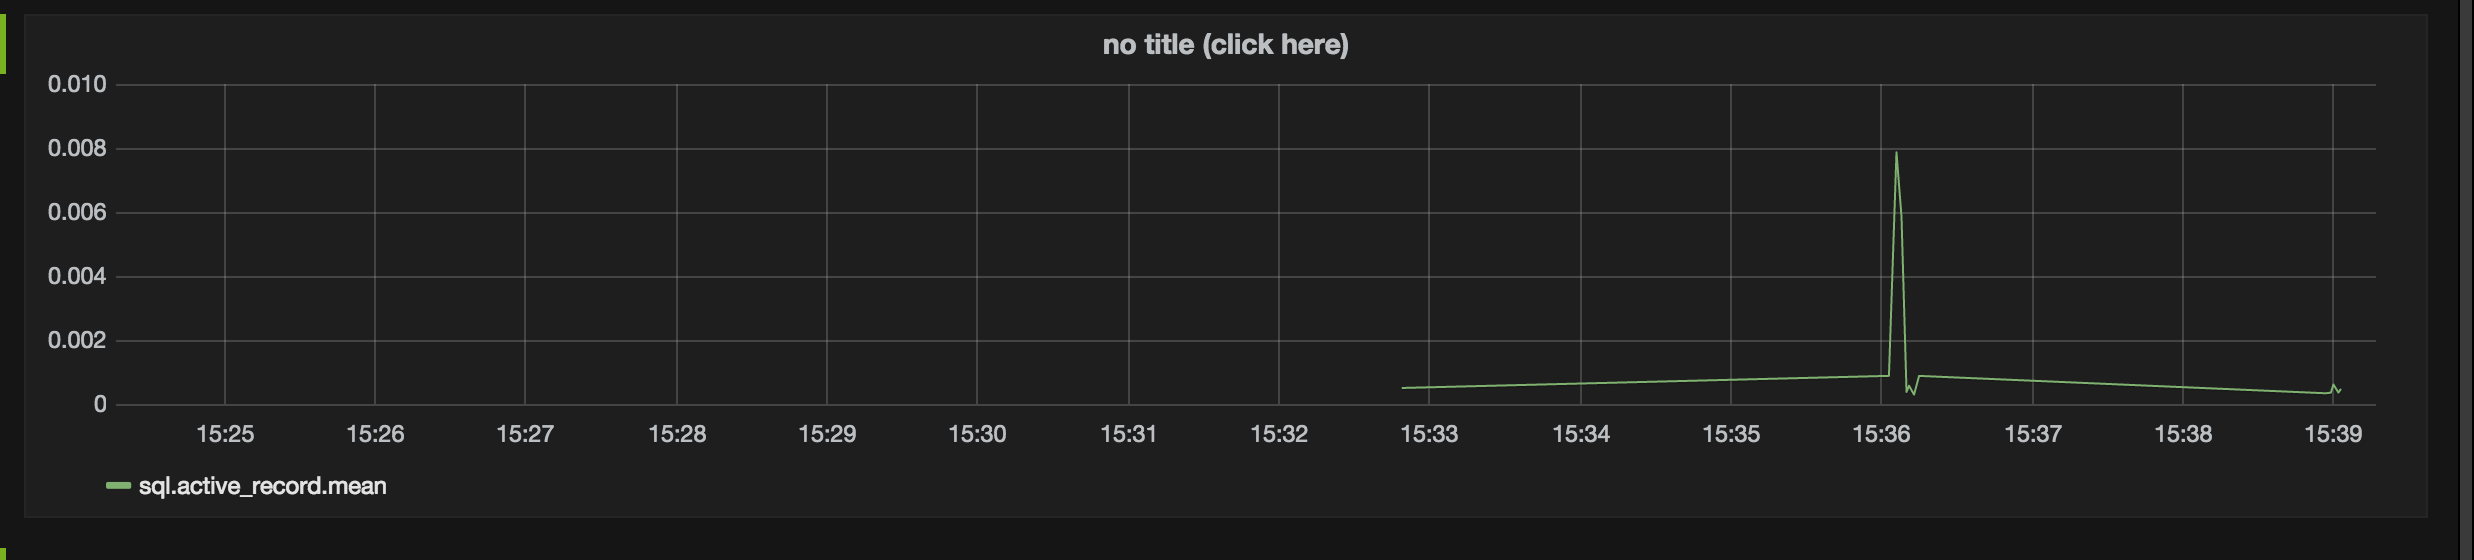
For example if we would like to track the execution times of queries in InfluxDB we can write an initializer:
ActiveSupport::Notifications.subscribe('sql.active_record') do |name, start, finish, id, payload|
InfluxDB::Rails.client.write_point(name, { value: (finish-start), start: start, finish: finish })
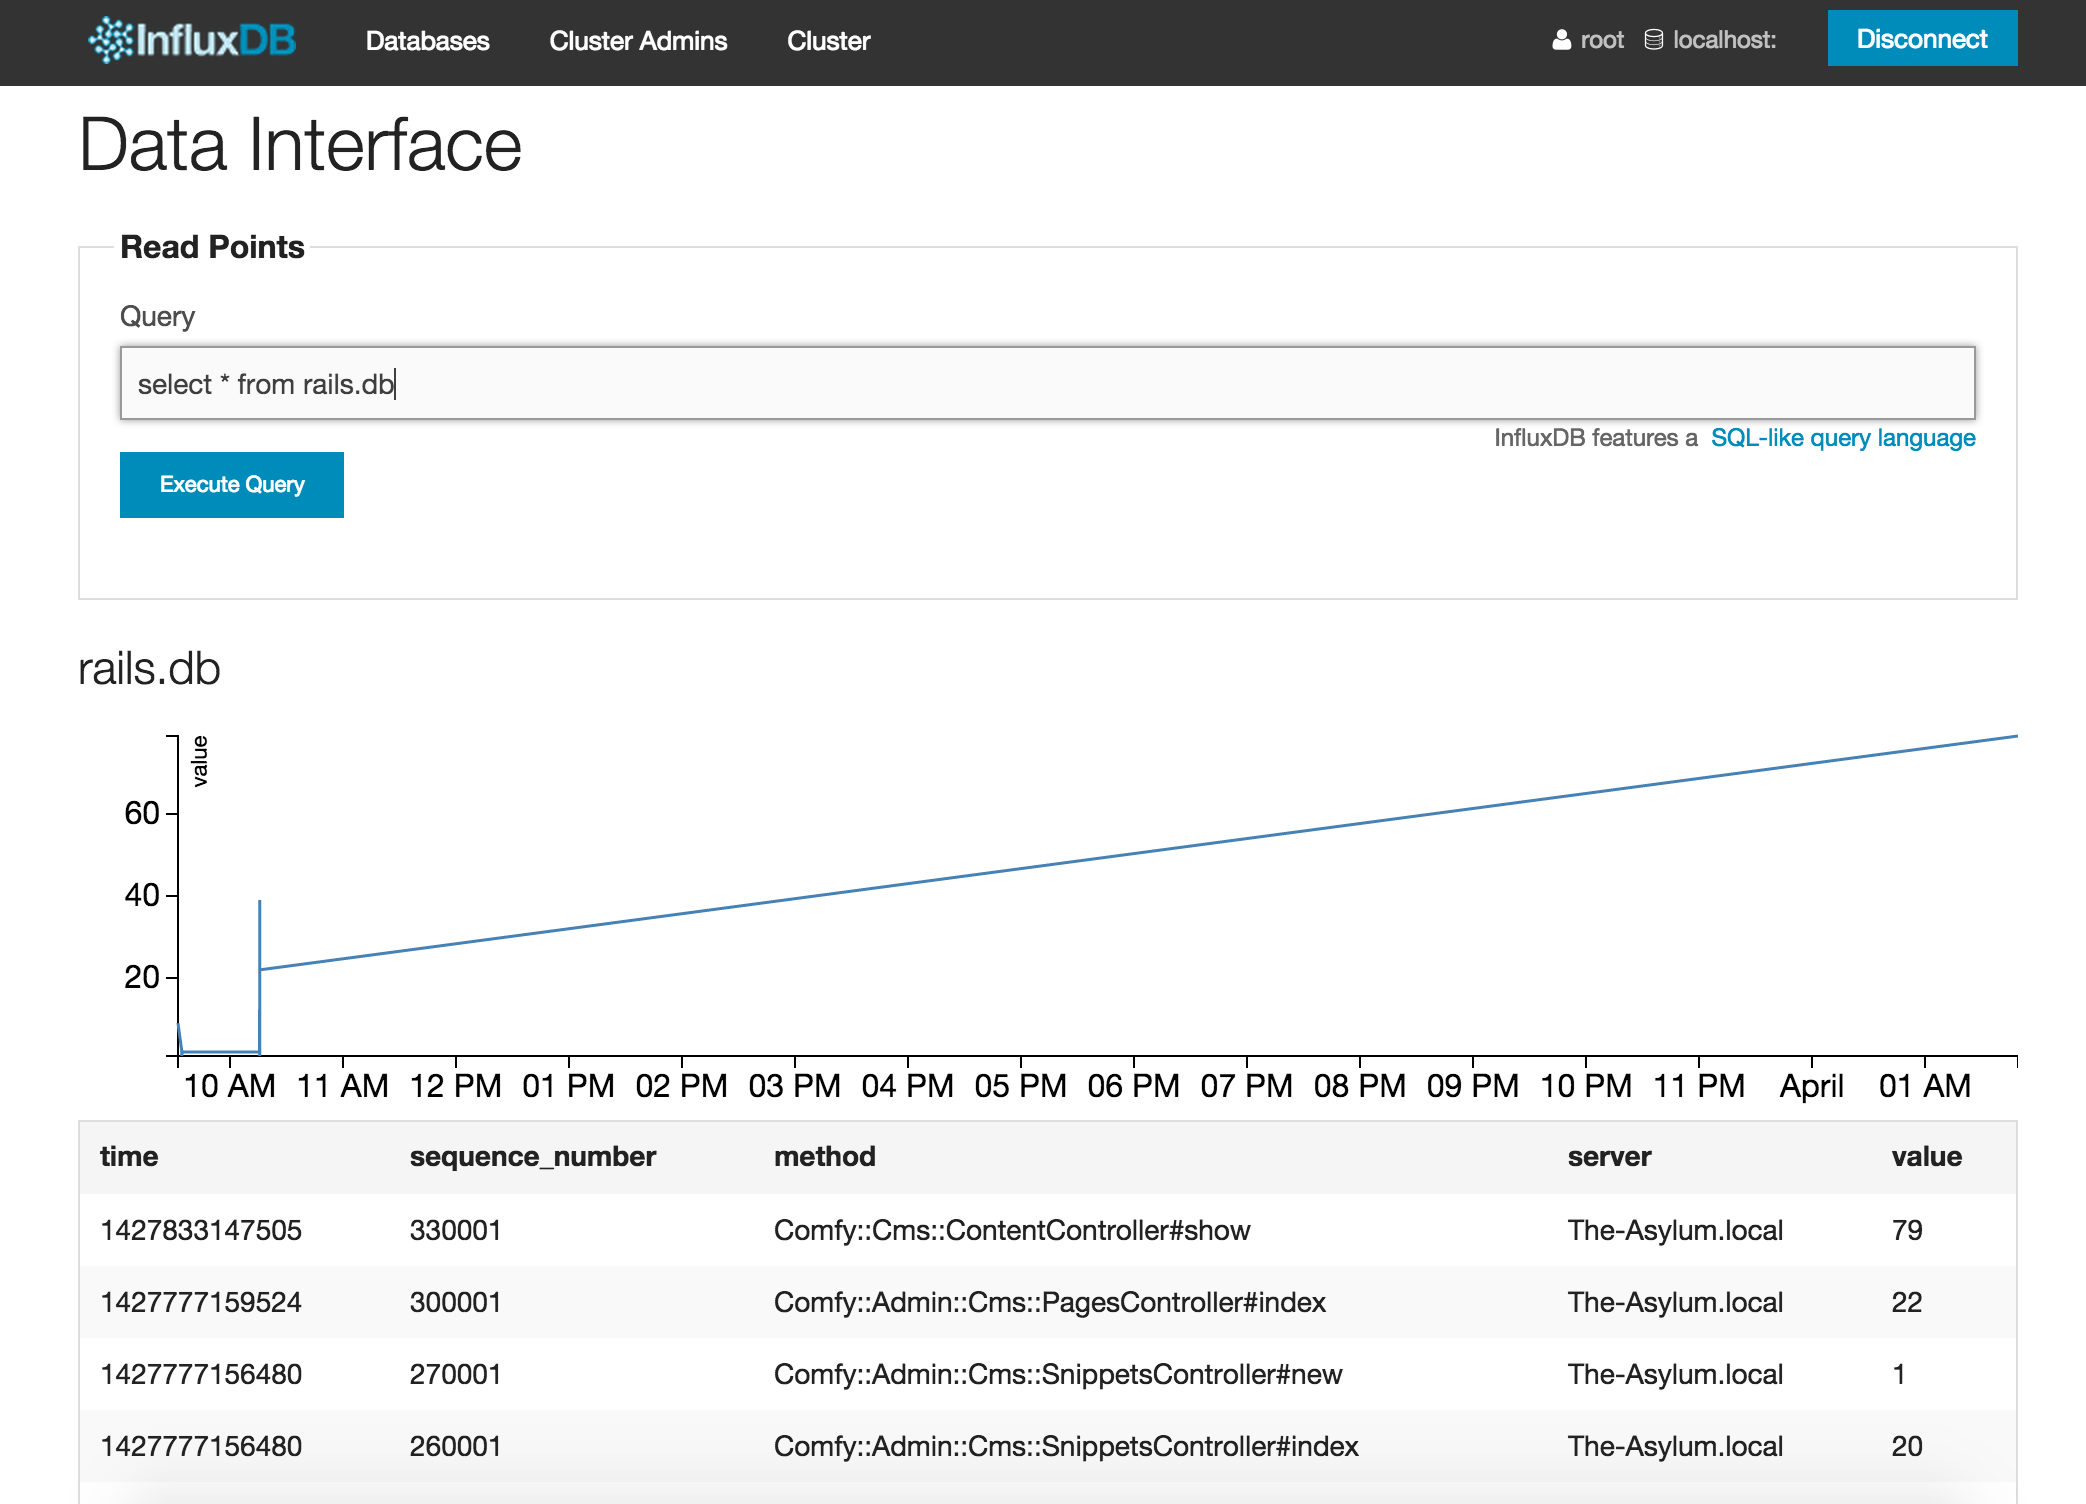
endThe value attribute is something that InfluxDB admin will use to generate graph by default. We can query this just like the previous queries:
More lifecycle events of Rails application can be found in the Rails guides.
In addition, the instrumentation API can be used directly to create a custom lifecycle events. Here is an example taken from the official documentation that outlines how a part of application code can be wrapped into an instrumented block which we could subscribe to in an identical fashion.
ActiveSupport::Notifications.instrument('render', extra: :information) do
  render text: 'Foo'
end
While the InfluxDB admin interface provides a convenient dashboard to visualize the metrics, it is not ideal for complex, comparative or realtime visualizations. For such use cases it is better to resort to dedicated solutions like Grafana.
Setting up Grafana
While Grafana releases binary downloads for most major versions of linux, there isn't one available for Mac. And neither is it available from Homebrew. However installation from the sources is straightforward if you have Go. It is important that the version of Go is correct (1.4 +) otherwise installation fails with totally incomprehensible errors. The version of Go available from Homebrew is outdated - however Google provides installers which work like a charm. Once Go is setup properly, the installation steps for Grafana are straightforward.
Another hiccup is that when running the web interface, Grafana uses the same default port as Rails (3000). To alleviate that we need to edit configuration file dev.ini in $GOPATH/src/github.com/grafana/grafana/conf and specify an alternate port
app_mode = development
[server]
router_logging = false
http_port = 8000
[log]
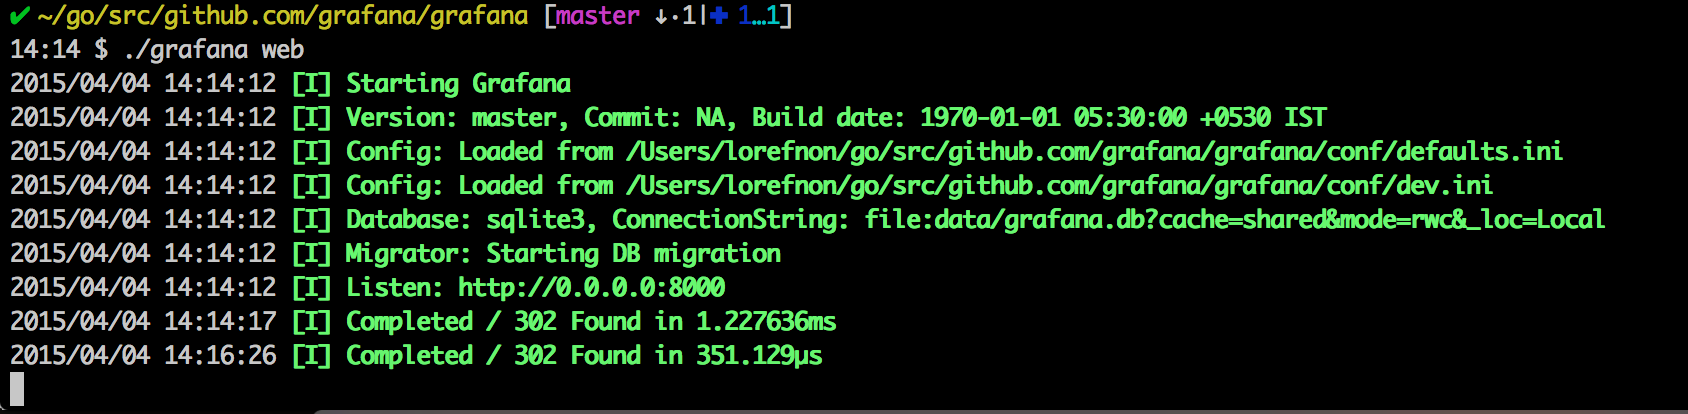
level = TraceOnce this is configured running ./grafana web from grafana source directory, should run the webserver on port 8000:
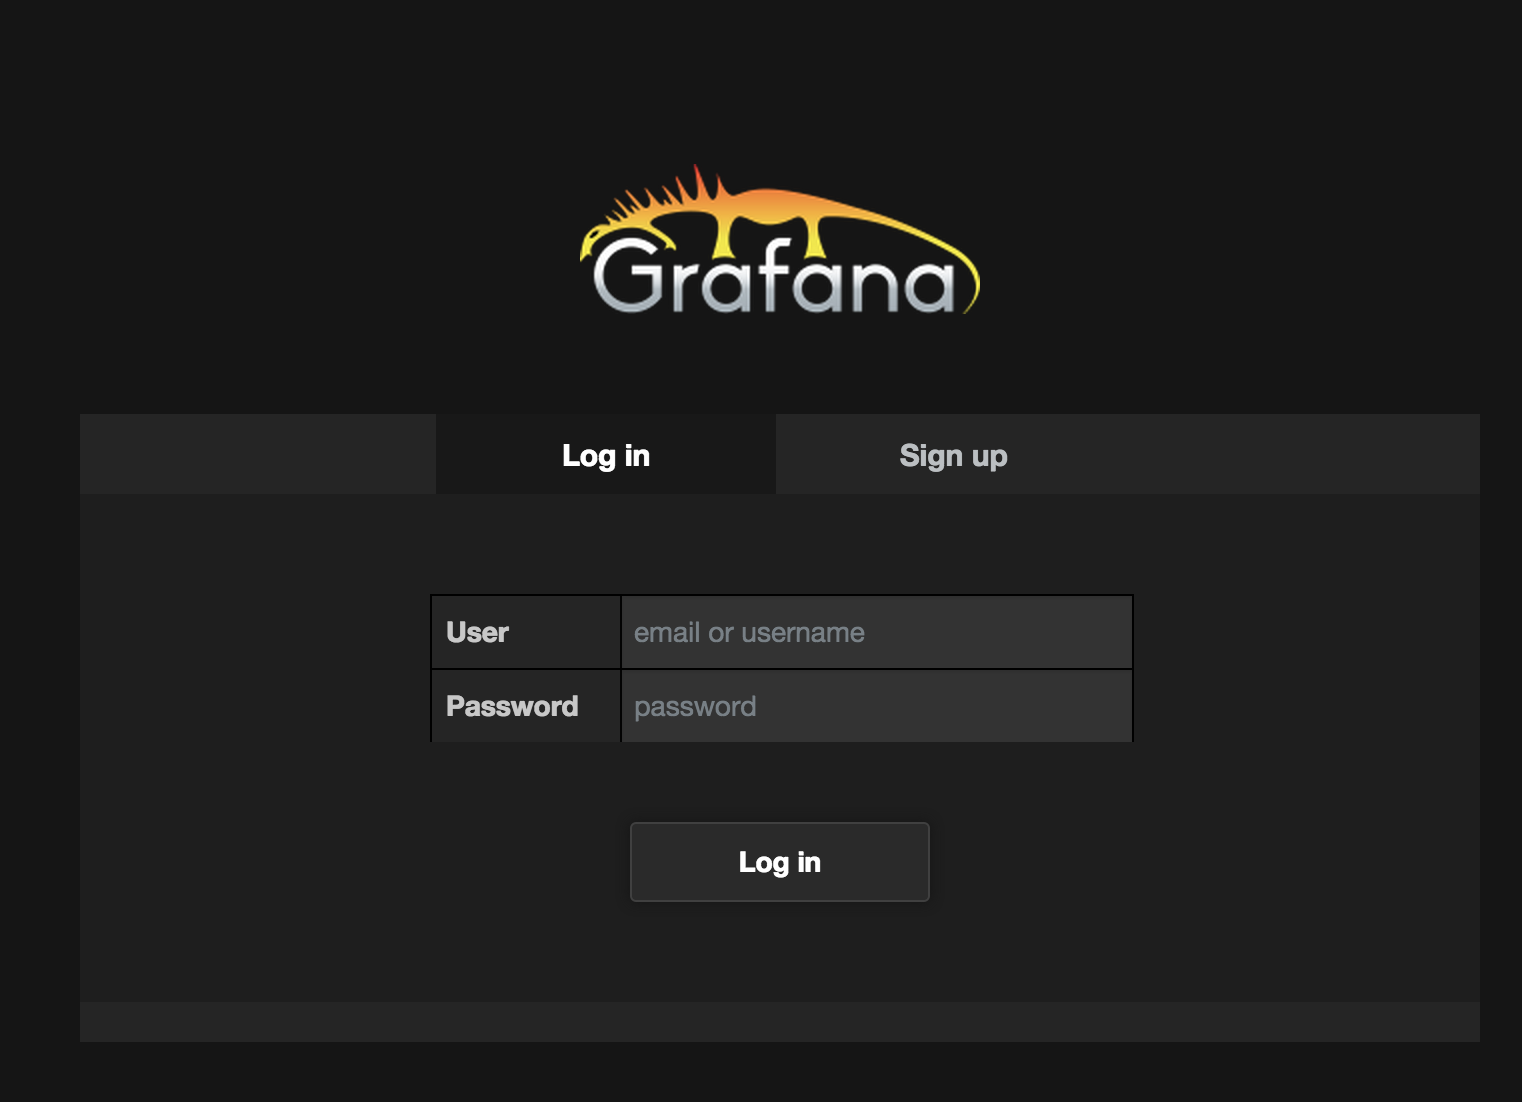
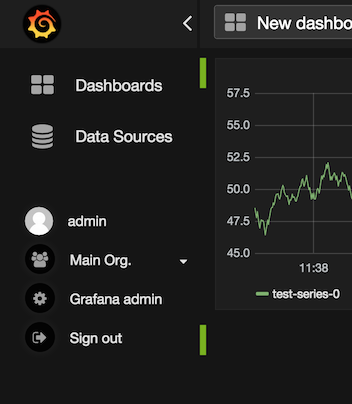
Now we can browse the Grafana dashboard and provide the default login details admin/admin. Again it is not advisable to use this in production.
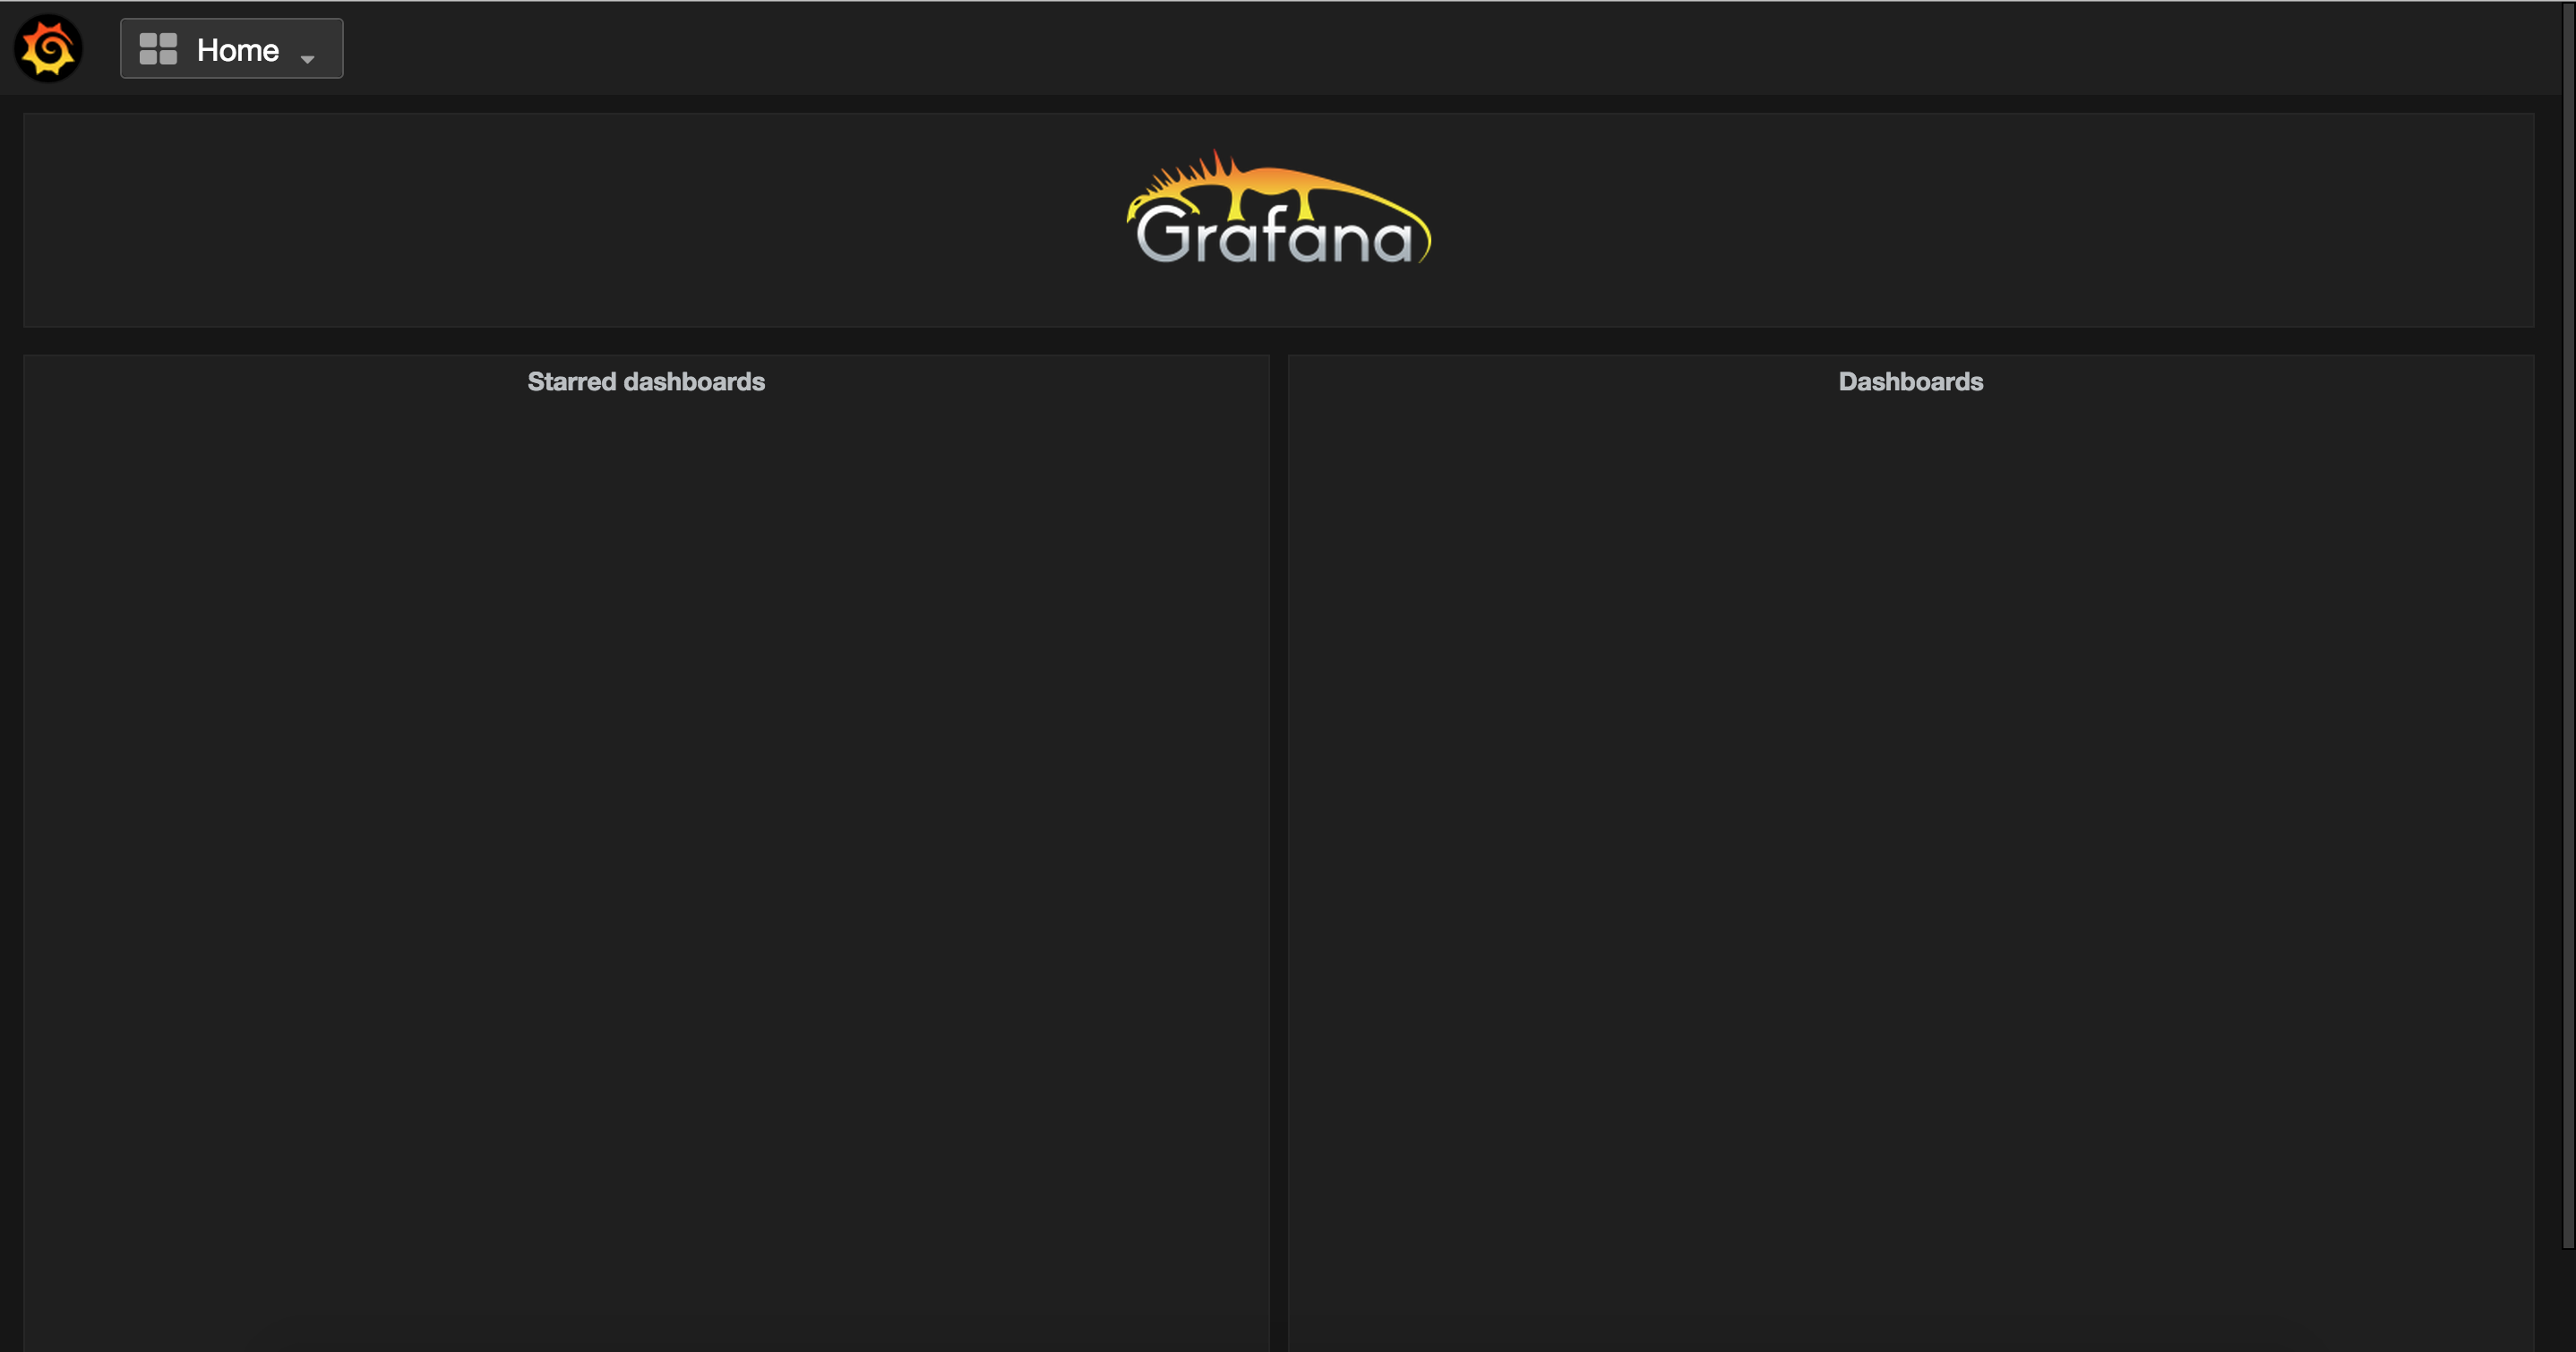
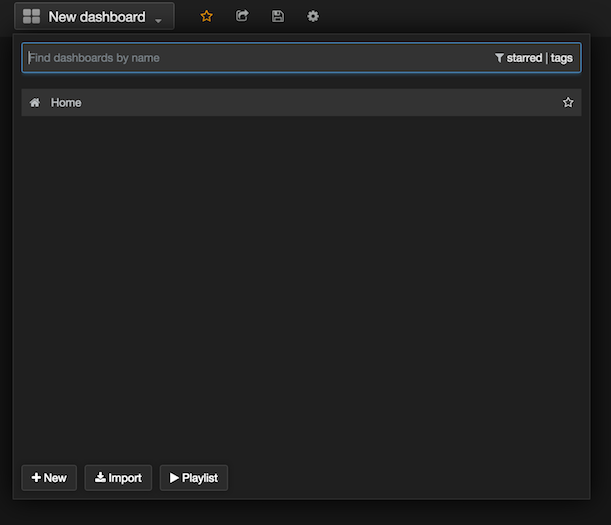
The default dashboard is pretty bare:
Adding a new dashboard is straightforward:
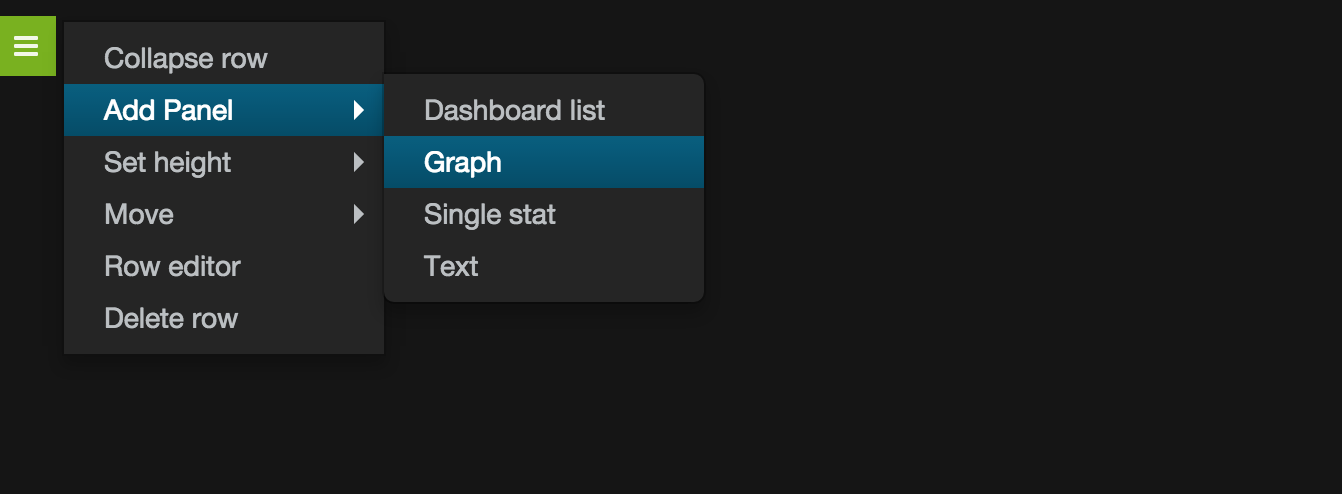
Once we have a dedicated dashboard for our Rails application we can start adding graphs:
It would be probably surprising to see a great looking graph instantly generated. After all no influxdb/rails specific configuration has been done yet, so what data is being presented ?
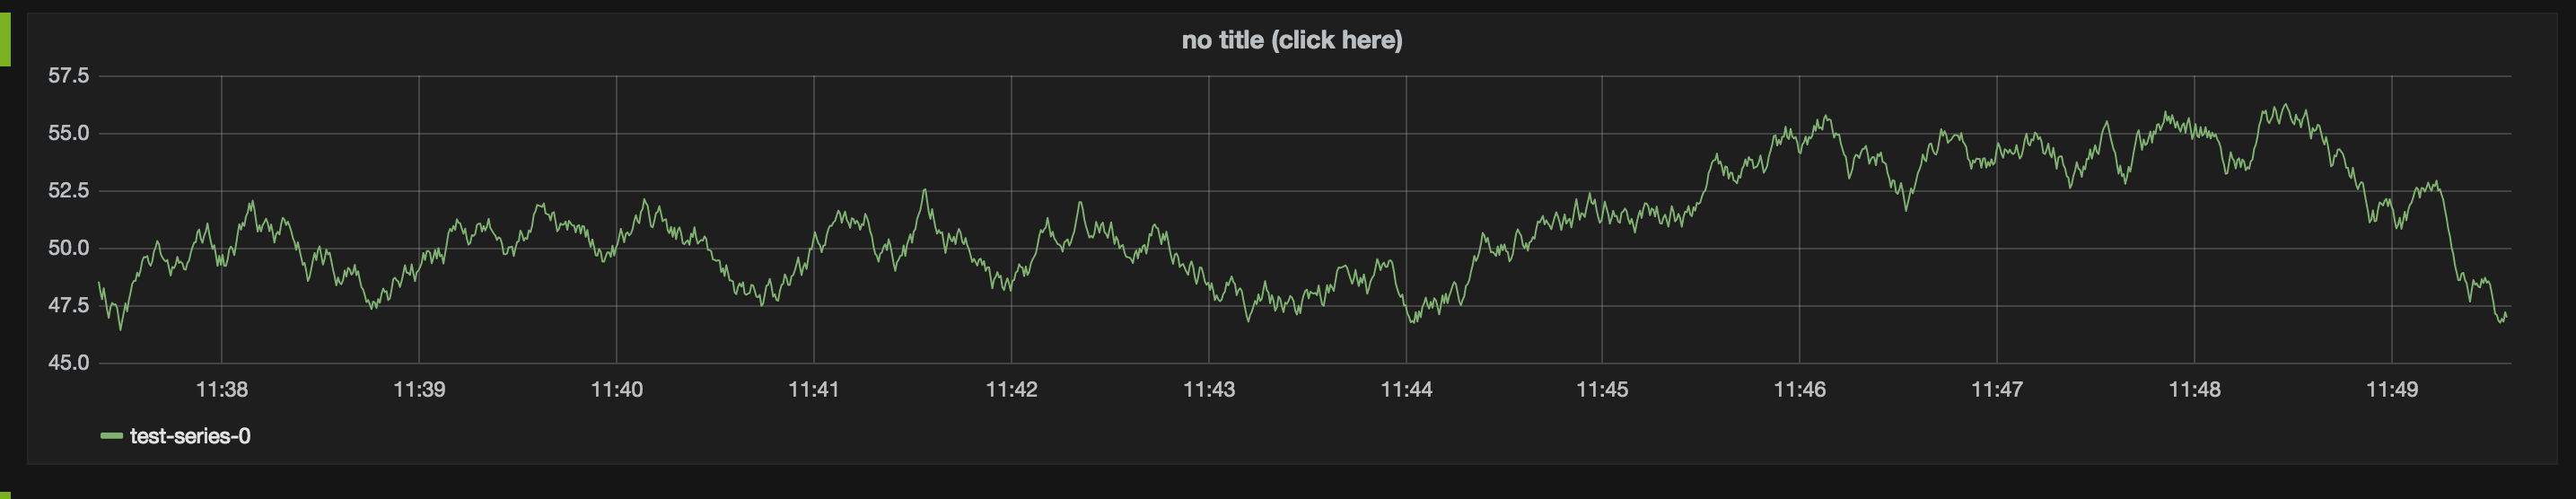
Once we try to edit the data source, it would become clear that the graph being presented is infact coming from a dummy data source
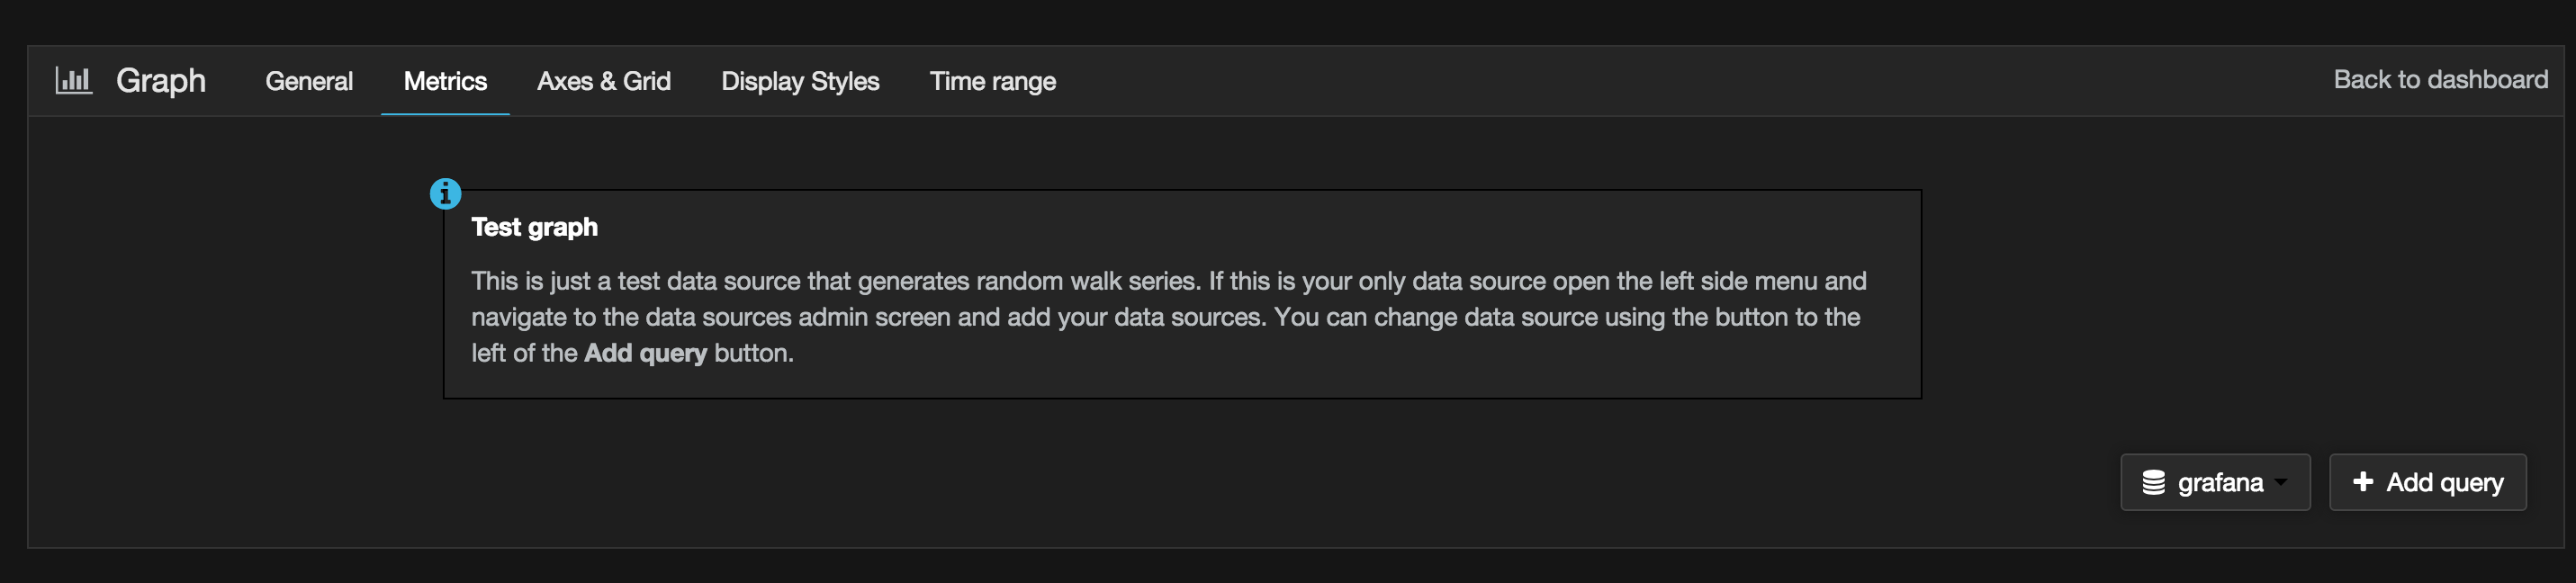
At this point, because InfluxDB data source hasn't been configured hence no other data source is available :
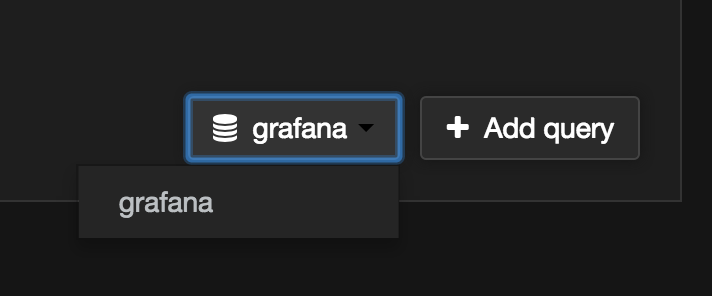
The sidebar has a section for data sources that can be used for this task:
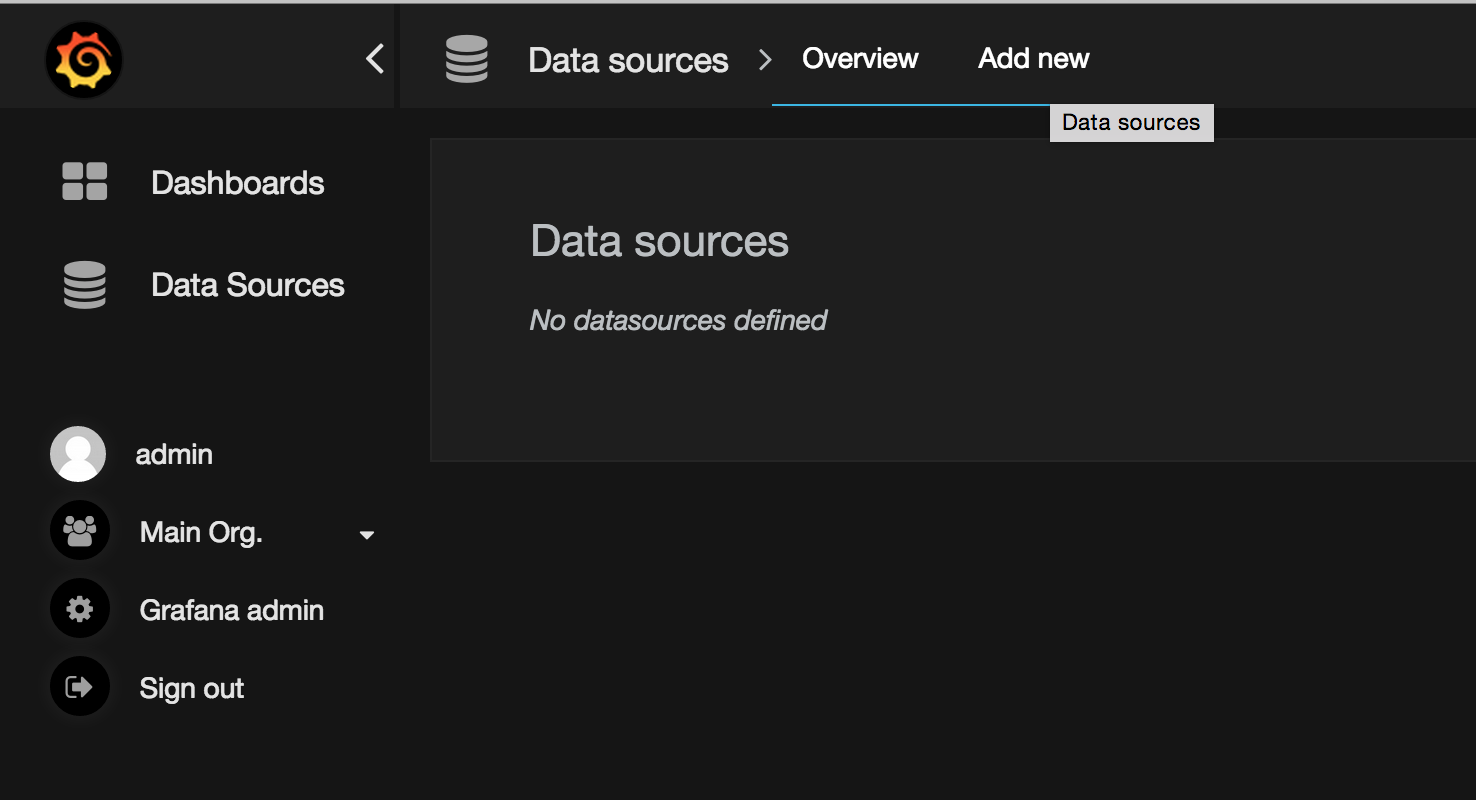
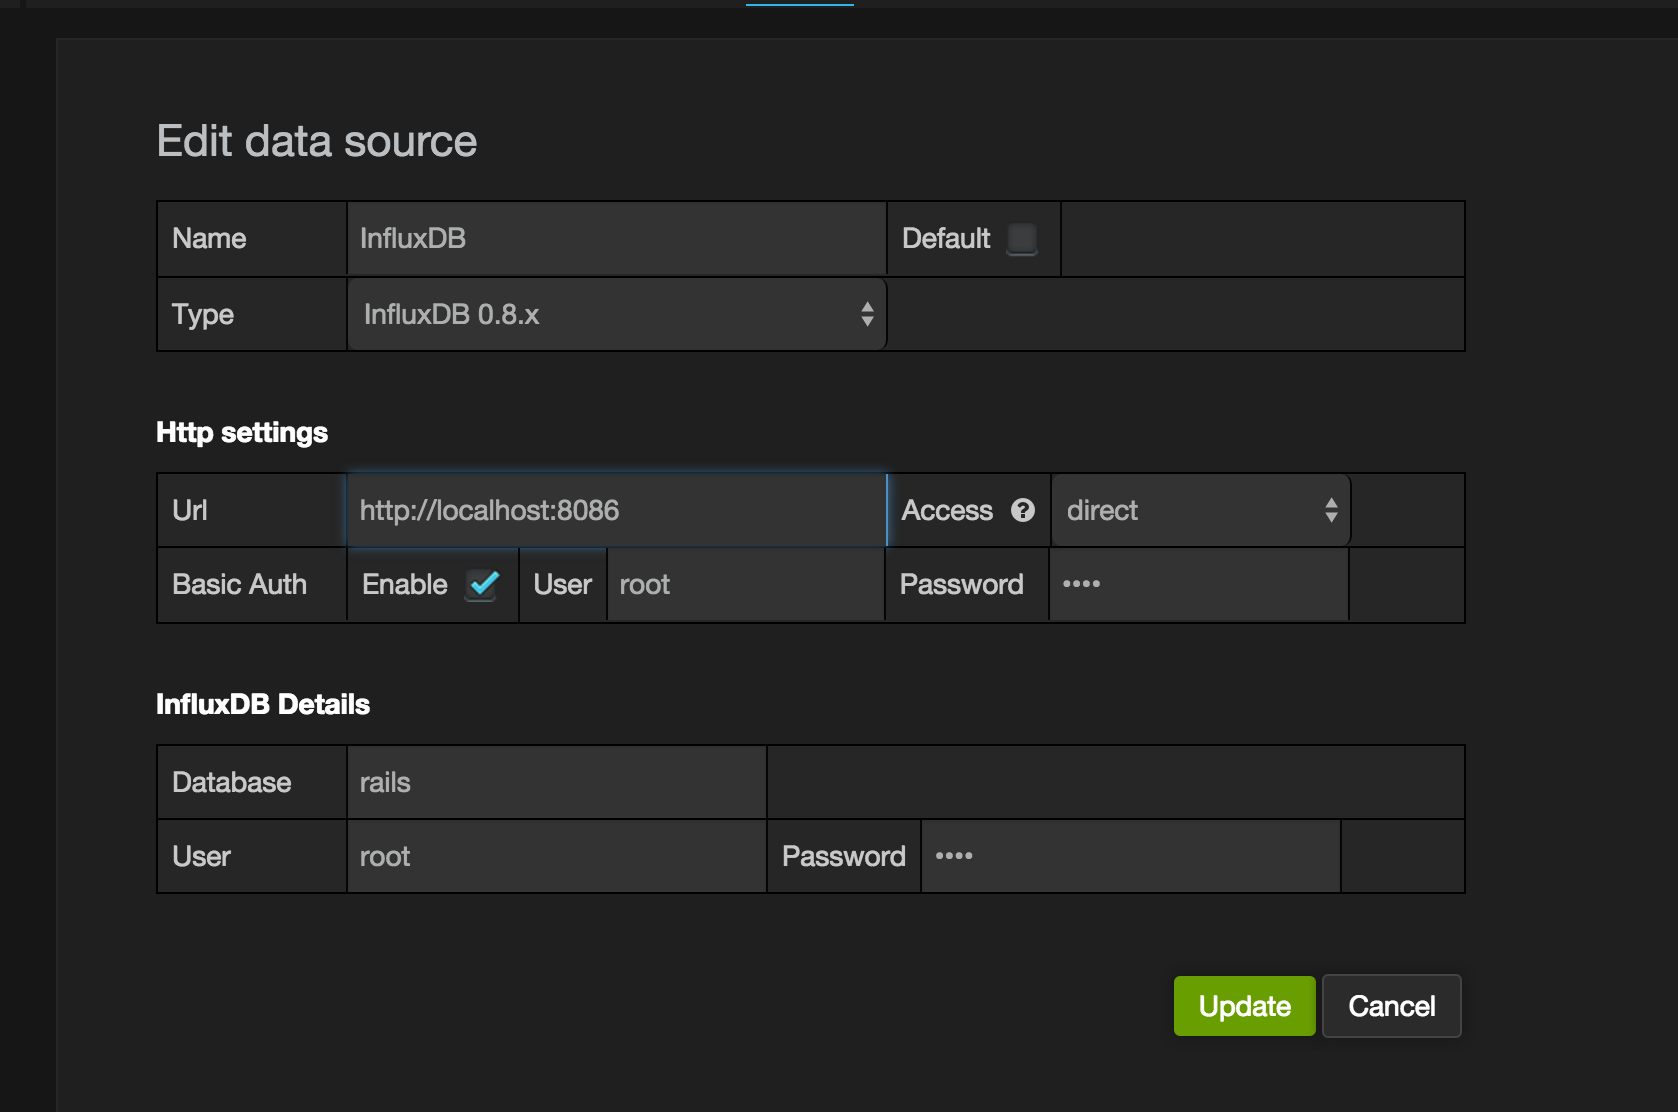
While adding a data source it is of particular importance the version of InfluxDB is correct in the type field. Rest of the fields in form are self explanatory - It is advisable that in production Auth is configured to protect against intrusion.
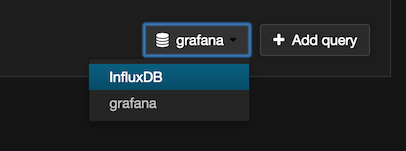
Now in the graph editor multiple data sources should be available:
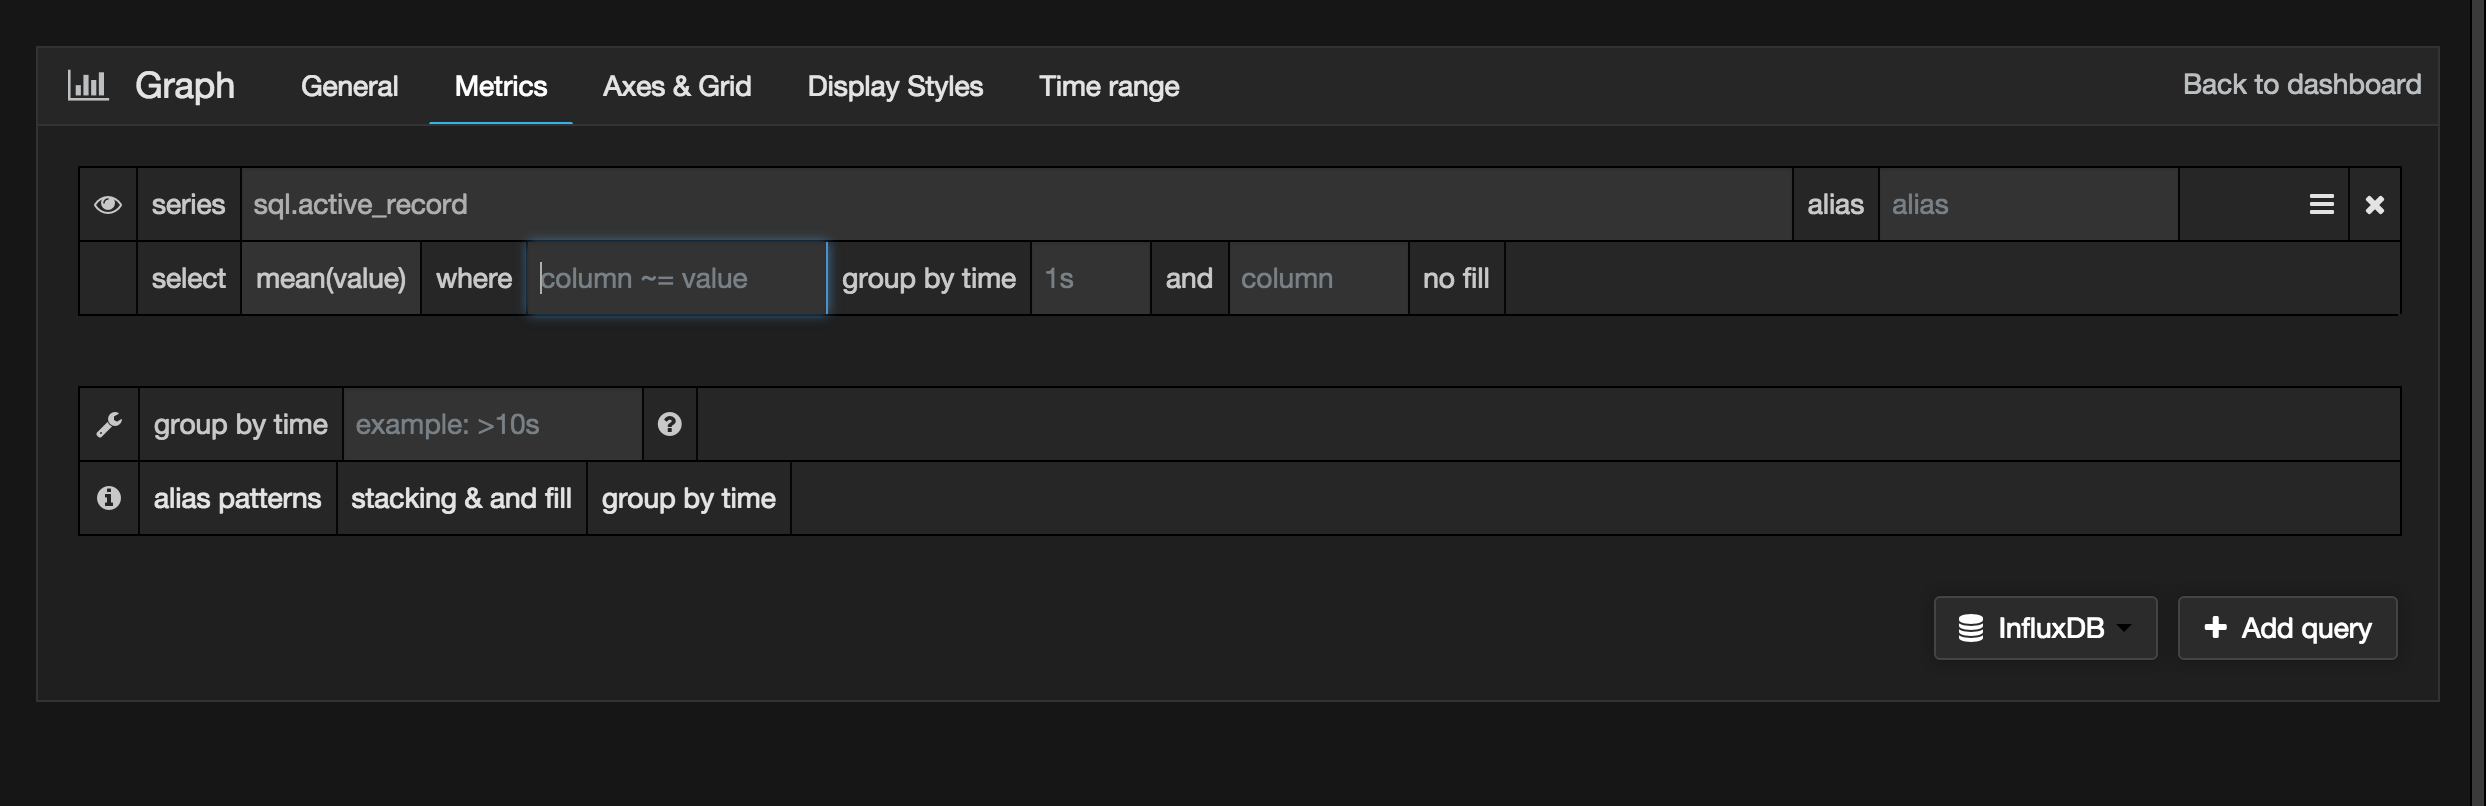
We can now specify the InfluxDB query to be made in the Metrics section:
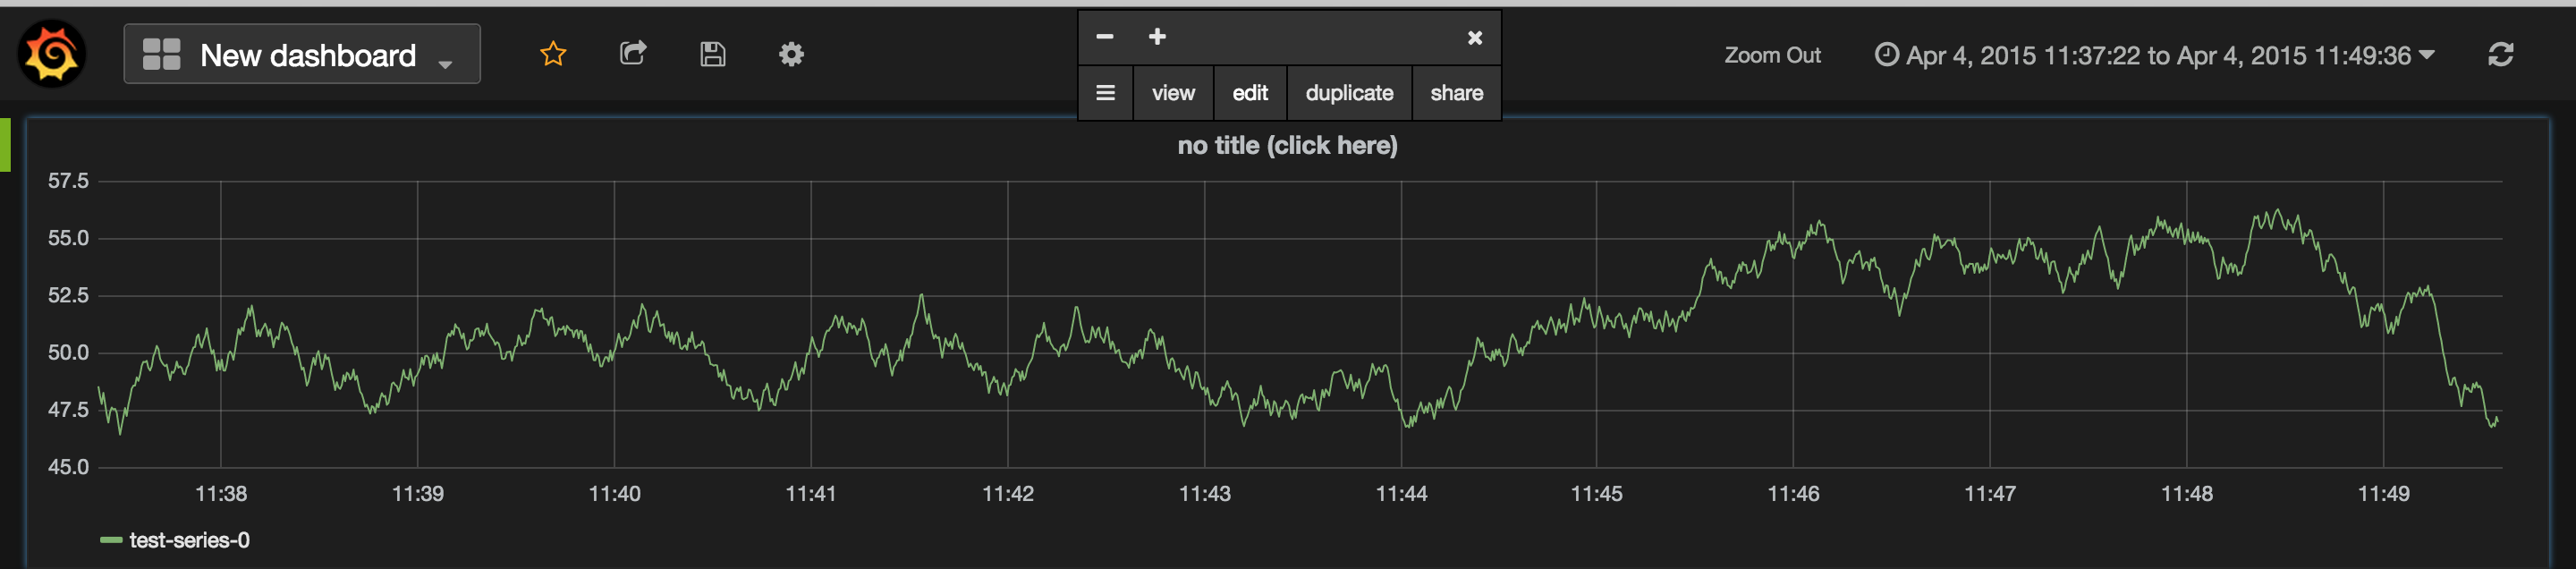
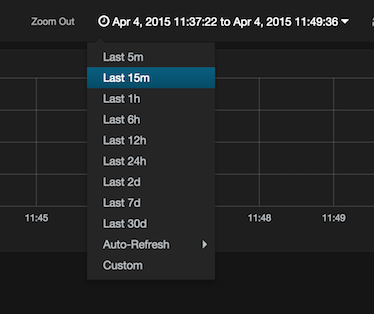
Since we don't have a lot of historical data at this point, for inspection we can adjust the time range to something recent:
The dummy graph should now be replaced with a real visualization of our metric
In similar fashion more graphs can be added and additional dashboards can be set up as per requirements.
Conclusion
This concludes this post, in which we have setup a basic development setup of InfluxDB and explored how a time series datastore can be used to save metrics from our Rails application and how we can query this data store and derive actionable insights. Also we explored creation of dashboards using Grafana to visualize these metrics in near-real time.
Our proof of concept setup, however is not suitable for production deployments with large volumes of data, in which case we would want to utilize advanced cluster management features of InfluxDB. Fortunately InfluxDB documentation already has a lot of helpful information on scaling up production deployment which is only expected to mature over time. There are also commercial options available for hosted InfluxDB which I encourage users to try out and evaluate.